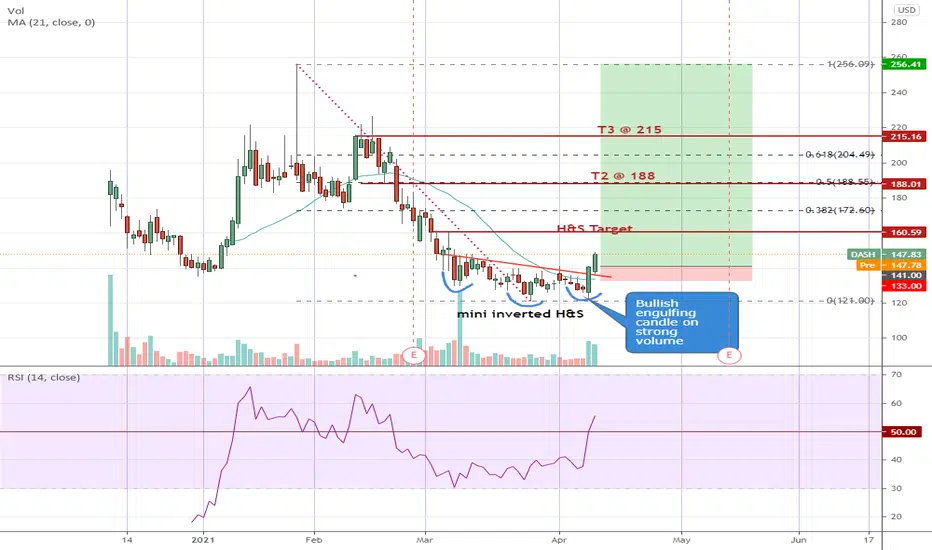
DASH - powerful price actionDASH bottomed out with a mini inverted Head & Shoulders before breaking above the neckline @ 136 with a strong bullish engulfing candle last Friday. More upside potential especially now with RSI clearing above 50.
Ideally one should have entered yesterday at the open @ 138 or as soon as it started to go above Fri's high @ 141. Otherwise, accumulate on any near term weakness with a tight initial stop loss below yesterday's candle ~ 133. Target shown are suggested only. Or ride the trade with trailing stops.
Disclaimer: This is just my own analysis and opinion for discussion and is not a trade advice. Kindly do your own due diligence and trade according to your own risk tolerance. Thank you. Feel free to give me your thoughts ! :)
Engulfing Candle
TSLA - Here we go (up) againAfter hitting a mini high of 780 on 14 April, and just when the bulls are thinking it is going straight to the moon, Telsa went into a rather painful correction. Finally we had enough signals last Friday to be optimistic that this recent correction could be over:
1. retraced 61.8% of it's recent CD swing up and appeared to have found support here by bouncing off here and
2. formed a bullish engulfing candle
3 bullish divergence seen between price and stochastics
Those who go long now will need to put the initial stop loss below it's last low of 666 (perhaps as low as 658). Should this trade fail, retest at the next significant support around 591.
Should the trade works out (which at this point the odds looks good), consider to take partial profits @ 780, then 900-925 and finally 1000.
Disclaimer: This is just my own analysis and opinion for discussion and is not a trade advice. Kindly do your own due diligence and trade according to your own risk tolerance and don't forget that money management is important! Thank you. Feel free to give me your thoughts ! :)

FILEcoin long setuoMost alt coins have had a unprecedented bull run over the last 8 months (as many assests have). So caution always needs to be applied but we can see that the 50 ema has not been violated by any bar closures and we can see strong bullish action on the chart.
With a space between the entry and the next two targets

what is next move of gold?if price breaks the resistance 1777 and confirms above it then we would looking for long positions.
but if resistance push price back down then we van expect bearish bearish move to support 1757.

Double bottom on goldThe price is creating double bottom pattern . We can see the confirmation from the candlestick pattern. The candlestick created the inside bar , then it created the bullish engulfing . We can take partial profit from fib 1.272 and the last target price will be on fib 1.618 . We can put the stop loss below the swing low.

Hive to 4.50 According to my analysis this going up to is resistance which is around 4.5$. Do like this post if you guys think same. Thankyou

SRMUSDT BuyHello Traders!
SRMUSDT is at the support area and is forming bullish engulfing pattern. You can buy from here to the next resistance.
Don't forget to hit the like button and follow to stay connected.

Short USDCHF on Bearish Engulfing at Resistance LevelShort USDCHF on Bearish Engulfing at resistance level.
Invalidation level: 0.91500


BANKNIFTY - Bottom in place ?Multiple observations for Bank Nifty Daily Chart:
> Double Bottom Chart Pattern
> Bullish RSI Divergence
> Bullish Engulfing Candlestick Pattern
> 38.2% Fibonacci Retracement done from September Low of 20404.9
A break above today's high could take it to next falling trendline close to 34500.
(Not an investment advise)

VUZI - Rebound in the works
VUZI tested and bounced off the last pivot low at 19.90 yesterday with a strong bullish divergence candle, establising a horizontal support here.
A bullish divergence is now apparent between it's price and RSI, it is likely to continue the upward momentum in the coming week.
Disclaimer: This is just my own analysis and opinion for discussion and is not a trade advice. Kindly do your own due diligence and trade according to your own risk tolerance. Thank you. Feel free to give me your thoughts ! :)

QCOM - Bullish Engulfing candle pattern on reverse zoneQCOM - Bullish Engulfing candle pattern on reverse zone

WANusdt Buy Hello traders!
Wan has formed a bullish engulfing pattern near the support area it means it was the final checkpoint of the bears now Wan is ready to break multiple bearish resistance and will make new highs. The new high will touch the trending line of previous highs. This pattern is also called expanding triangle.
Target at the top will give 70% gains of the investment.
Don't forget to hit the like button and follow to stay connected.

NTAP - Engulfing with Insidebar at three daysNTAP - Engulfing with Insidebar at three days on resistance zone

BTC - W1 - WARNING ! BEARISH ENGULFING PATTERN !!!W1 : Last week price action triggered a BEARISH ENGULFING PATTERN !
Interesting to note that lowest seen was 51'541, close to the 38.2% Fib ret
@ 51106.
Of course, such kind of bearish candlesticks, should be, in this W1 time frame,
confirmed on a closing basis at the end of this week !
Nevertheless, the fact that we get out of the uptrend channel is one of the first
warning signal that the former bullish trend could be over.
Watch shorter time frames to monitor the ongoing price action which would allow to act accordingly
on the time frames you choose for your trading strategies !
Have a nice trading week, all the best, take care and have fun !
May your long goes up and your short goes down.
And finally, please do not hesitate, of course, if you find, my technical analysis approach, valuable for you, to like it
and to add me, if it is not done yet, on your following list.
Ironman88848

EURUSD-Weekly Market Analysis-Apr21,Wk4The red box(sell zone) is drawn on the daily chart, I'm waiting for a bearish engulfing candle on the 1-hourly chart for a shorting opportunity.

INTU - Inside bar after bearish engulfing on supply zoneINTU - Inside bar after bearish engulfing on supply zone


AMC: 2 key points and 2 strategies you can use!Hello traders and investors! Let’s talk about AMC again! Since it hit our target, about two weeks ago, it has been moving sideways, and movements like this are frustrating, yes, but we have some very nice key points to keep in mind.
First, in the 1h chart, we still have a key point at the green line, around $ 11.52, which is the same key point we mentioned in our last study ( link to my previous analysis below). And we have the red line at $ 8.95.
Probably AMC will keep trading sideways for some time, but we have two scenarios to work with if we see a breakout from these lines:
Since we have a congestion , it can break in any direction. But we have some targets to work with in whatever direction it breaks.
By defeating the green line, the next stop will be the blue line at $ 14.54 , then the last target would be the $ 20.36.
We have a Bullish Engulfing , that almost reversed the trend, but I wasn’t convinced by it, and the reasons are in our last AMC analysis. All I can say right now is if it loses this pattern’s low, meaning, the $ 8.95, then the $ 5.22 is the next target for the stock.
The volume is too low, but if AMC reacts near the support at $ 8.95 it could trigger another buy sign, as the R/R ratio would be very good.
Either way, let’s be prepared, and if you liked this post, remember to follow me to keep in touch with my daily studies, and please, support this idea with your like!
Thank you very much!

$ASTC Astrotech Corporation operates as a science and technology development and commercialization company in the United States. It operates through two segments, 1st Detect Corporation and AgLAB Inc. The 1st Detect Corporation segment manufactures explosives and narcotics trace detectors for use at airports, secured facilities, and borders. This segment provides TRACER 1000, a mass spectrometer based explosives trace detector to replace the explosives and narcotics trace detectors used at airports, cargo and secured facilities, and borders. The AgLAB Inc. segment develops AgLAB-1000, a mass spectrometer for use in the agriculture market for process control and the detection of trace amounts of solvents and pesticides. It also develops BreathTest-1000, a breath analysis tool to screen for volatile organic compound metabolites found in a person's breath. The company was formerly known as SPACEHAB, Inc. and changed its name to Astrotech Corporation in 2009. Astrotech Corporation was founded in 1984 is based in Austin, Texas.

VIS CONTINUE UP UP UP?MYX:VIS
UPTREND
FAST TURTLE BUY
BULLISH ENGULFING
FiFT +VE BULL RECHARGE
MCDX+ BANKER TURN STRONG
BANKER 65%
TREND SIGNAL TURN GREEN
