ETH - May the BULLS be with us!Okay, so ETH did a classical bullish sign to us, a bullish engulf near a strong support area, made of 1 - the 21 ema; 2 - the purple trendline; and 3 - near the black line (previous top). Our last trade here was a very good one, we long at that “Harami cross” in the chart all the way to the 61.8% fib retracement, the links about this trade are all bellow. Also, I invite you to follow me to keep in touch with our trades and analyzes.
Now let’s see the hourly chart:
Here we find a reading similar to the daily chart, and I’ll stress how important will be for the bulls if they manage to keep the price above that blue line, which is the fib retracement. There’re some supports here, like the green line, the pink line, the black line, and finally, the purple trendline. Now, the weekly chart:
As I’ve been saying, yes it bugs me a little that the price is near a fib retracement, but we can’t discard a “V” pattern here. The bulls seems to be very strong, and the trend will continue until a clear reversal sign occur (as Charles Dow used to say). Meanwhile, we are long here.
Remember to follow me, I'm a trader who uses the classic technical analysis (barely any indicator, just the candles and the volume). Like this idea if it helped.
Thank you very much.
* LIKE this idea and FOLLOW me, because:
- Here, you will see clean charts;
- Trades with clear risk management;
- The best of Dow Theory, Price Action and Candlestick psychology;
- Chart patterns with statistics. *
* My name is Nathan, I'm a trader and portfolio manager and I'm here to LEARN. Leave your COMMENT and FOLLOW me to keep in touch. *
Engulfing Candle


XRP - About to PULL the TRIGGER.Ok, so the price found a support in the 21 ema and the purple trendline, which is great for the bulls, and now it seems it is doing a bullish engulf, like some other cryptos are doing. Let’s see if this pattern will be triggered tomorrow, if so, it’s a long, the target could be the pink trendline or the 61.8% fib retracement. Let’s look the hourly chart for more information:
It would be very good if the price close above that blue line, but I don’t know if that’s going to happen. Now let’s see the weekly chart:
It’s near the 21 ema, which could be a resistance too, but I find this volume increase very interesting. I wonder what caused that sudden raise.
Remember to follow me, I’m a trader who uses the classic technical analysis (barely any indicator, just the candles and the volume). Like this idea if it helped.
Thank you very much.
* LIKE this idea and FOLLOW me, because:
- Here, you will see clean charts;
- Trades with clear risk management;
- The best of Dow Theory, Price Action and Candlestick psychology;
- Chart patterns with statistics. *
* My name is Nathan, I'm a trader and portfolio manager and I'm here to LEARN. Leave your COMMENT and FOLLOW me to keep in touch. *

Are the BULLS going to SHOW UP? (again)Hello guys! Now ETH is starting to get interesting again. Its been a few days since ETH entered on the “Sleep Mode”, which is normal after the last bullish move it did. We managed to catch that last move , we were long from U$ 175 to the 61.8% fib retracement, our main target. If you missed, I’ll post the links of my previous analysis below, and remember to follow me to keep updated of our trades.
For now, what I can say is that ETH may do a Bullish Engulf , after it touched the purple trendline, near the 21 ema. A bullish sign, that would be even better if the price closed above the U$ 214 today or tomorrow. It’s important to surpass that fib retracement. Now, we calmly wait for the pattern to confirm. You can buy today, in the last minutes of the candle (if in fact, is a Bullish Engulf), or you can wait for even more confirmation, and buy if tomorrow the price will go higher than today’s high. Personally, I like to wait for the confirmation in the next day.
We can look at the hourly chart to see if there’s more:
If I was a day trader that Piercing Line would've done my day. It went to the “support zone” and close above the black line, which is an important support here. Also, here we can see how important is for ETH to close above blue line (61.8% fib), because it would be the start of a bullish trend in the hourly chart too.
Now, let’s look at the weekly chart:
I confess that the fact we are near a fib retracement still bugs me a little, but I’ll do my best to follow the trend. Maybe we will see a V pattern in the weekly chart, I don’t know. Either way, the cards are given.
Remember to follow me, I’m a trader who uses the classic technical analysis (barely any indicator, just the candles and the volume). Like this idea if it helped.
Thank you very much.
* LIKE this idea and FOLLOW me, because:
- Here, you will see clean charts;
- Trades with clear risk management;
- The best of Dow Theory, Price Action and Candlestick psychology;
- Chart patterns with statistics. *
* My name is Nathan, I'm a trader and portfolio manager and I'm here to LEARN. Leave your COMMENT and FOLLOW me to keep in touch. *

E/A 1M Trend - Short Trend shows clear upside movement to reaching 1.9, with some recent volatility indicating reversal by way of candlestick patterns, likely bearish engulfing.

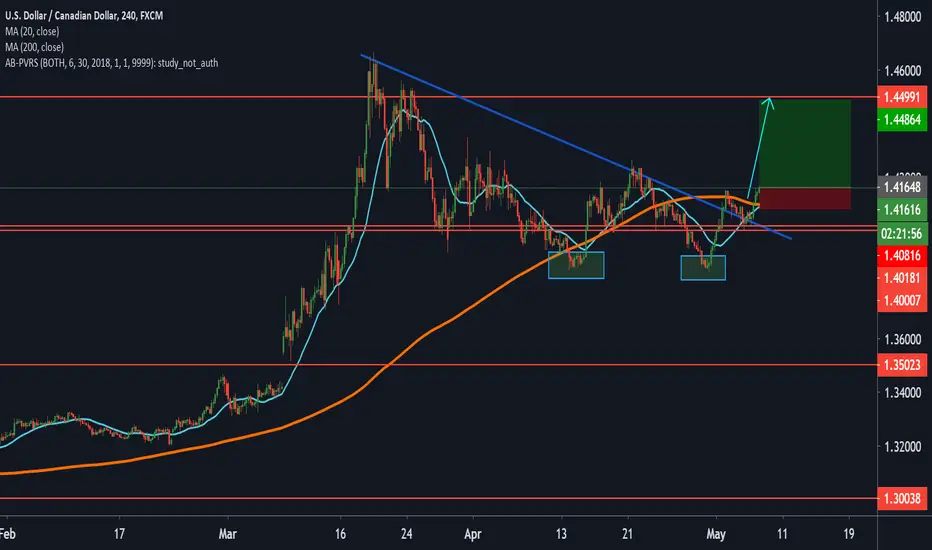
USDCAD Long for 400pips Hello Guys, i am looking to take this trade on the long side, based on the DOUBLE BOTTOM, crossing on the 200 SMA on the 4H and also the confirmation of the resistance with some powerful BULLISH ENGULFIN partter.
Elliot Wave Corrective Wave, 70% Sell OpportunityChart Patterns: Standard Elliot 8 Wave Cycle, Corrective Phase
Entry price: 0.64128
Stop Loss Price: 0.64831
Take Profit Price: 0.62604
Estimated Duration: 2-5 Days
Probability to Meet Target: 70%

TCEHY - A view of an old school trader.As another request, I’ll do an analysis of TCEHY today. Well, we can say that Tencent is doing what was expected to do, after it hit the “resistance zone” is now dropping and it seems it find a bottom at the light blue line in the chart, which is the previous top zone.
TCEHY is doing some very precise and technical moves here, and now it did a bullish pattern, a downside tasuki gap, maybe? Or bullish engulf? Don’t know, and don’t matter really.
Just be aware, because if it loses this light blue line the stock may face some trouble. Let’s see the hourly chart for some clues:
The price lost an upward trendline (blue line), and it’s in a support zone, as it is in the daily chart. The rule here is the same, if it loses that blue line, expect it will seek for the lowers supports. Look at the daily chart again, these supports may be the thin pink line or even that thick red line.
Personally, I think there’re more interesting stuff to trade right now, but if you want to buy Tencent, you can, but be aware of the low volume today and most important, the “resistance zone”.
Trade well my friends and be safe.
Remember to follow me, I’m a trader who uses the classic technical analysis (barely any indicator, just the candles and the volume). Like this idea if it helped.
Thank you very much.
* LIKE this idea and FOLLOW me, because:
- Here, you will see clean charts;
- Trades with clear risk management;
- The best of Dow Theory, Price Action and Candlestick psychology;
- Chart patterns with statistics. *
* My name is Nathan, I'm a trader and portfolio manager and I'm here to LEARN. Leave your COMMENT and FOLLOW me to keep in touch. *

S&P 500 | false breakout and then plunge the wedge
the index future looks bearish
fib retracement 0.618 met
engulfing reserval candlestick pattern broke back the resistance
and then plunged the wedge, a very bearish pattern

AUDJPY | reversal candlestick pattern indicates a false breakout
a trap of bullish breakout buyers may fuse a new downward price action


Trade Ideas Educator: AUDCAD S&RThe market has failed many times in breaking and closing above the previous high since 20April20. Granted that there is a break above but there isn't a close above of the candle, and having more and more of such it shows that market do not have the strength to close on the high price.
On market open, I'm waiting for a break and close below the candle with yellow eclipsed for a shorting opportunity.

AUDNZD Long (Continuation Update)Affter got this retest to the support we have more confirmation for strong buy!
Daily Candle very bulishh and one more time the weekly analysis is very bulish and the price must complete the channel that is possible to make at weekly time frame.
Only Canceled if cross the support again

EURUSD Affter Break Any LineWe can see two oposite trend lines that can seems like a triangle. This two lines are being very respected by the price so we can expect the main direction affter break any off them and with the right rejection trigger for the enter.
In my point of view may be a long position because we can see a bulish engulfing candlestick pattern and the price got rejection some times at the support.
But we only now affter some breakout.


NYSE: NEO crossed previous Daily highNEO crossed the previous daily high with a bullish engulfing pattern.
H1 chart is showing a retest and a nice pullback.

NZDUSD [SHORT]Hello traders,
EP: 0.59700
+ Trendline breakout
+ Fibonnaci 50% level retracement + Bearish engulfing candles
+ Monthly support breakout
+ MACD bearish
Comment bellow what your opinion is on this pair!!
+ Follow me to stay updated on my setups

EURNZD [LONG]Hello traders,
Trendline breakout
Retracement on Fibonacci level 61.8% + 1 Month Support
Shooting star + Bullish Engulfing
Comment your opinion on this pair!!
+ Follow me to get updates on all my setups

Possible Double TopHey Guys just an IDEA. So seeing a bit of a rejection at the resistance zone again, possibility of a double top happening. It broke out of two trend lines and now its retesting a zone. So lets see how the 1 hour and 4 hour candles close. On the 1 hour it kinda closed with a big shadow/bearish engulfing candle stick but went back up. Might be forming a double top on the 1 hour chart as well. If it breaks to the top we could enter a buy trade once it retests or if the price doesn't break we can see a double top on the 1 hour chart and enter possible sell trades. Lets see how it plays out. Happy trading.

USDCHF M SELL NOW!HERE IS A INTRADAY SELL SETUP ON USDCHF. PRICE IS RESPECTING THE RESISTANCE AND HAS FORMED AN M, PRICE INITIALLY DID A FAKE OUT TO CUT THE SELLERS OUT AND HAS NOW FORMED A BEARISH ENGULFING ON THE 1 HOUR CHART. I'D EXPECT TO SEE THIS PAIR TO NOW MOVE TO THE DOWNSIDE. OVER 3.5 TO 1 RR FOR THIS SETUP AND LOOKS GOOD. LETS SEE WHAT HAPPENS.

Bullish Engulfing Candle Close on the 1day Chartalways a bullish sign..we also closed with volume above the 4hr chart falling wedge and the 1 day bull flag.


