Water is 2020's winner so farThe 3 leaders YTD have been (in order): Utilities, Healthcare, Staples; which happen to be the 3 most defensive sectors, who tend to outperform during a recession...
Inside the utilities sector, the Water industry is the leader.
CWCO has a beautiful looking chart, setting a strong support after making a double-bottom, which immediately after, made a bullish engulfing candle. It is interesting to note, that the volume on this 2-day event; was almost identical. Meaning the amount of buyers was larger than the seller side.
Engulfing Candle

CADJPYThis is a late set up from last night after seeing the bull Engulf. The entry was abit late but the setup was successful.

SPX Final Support: 200 WMAChart says all. Has been support in 2015/16 and 2018. WIll it hold again? I hope so; I'm going long here. 2054 is just 90 pips below now, IMO might see it this week.
We do have a Bearish engulfing candle on 3/11, ominous for lower... but price forms a descending wedge, pop could come anytime now IMO.
The selloff was so rapid and intense, the buyback will be a vertical recovery IMO.
Not advice; trade at your own risk, GLTA!


#STX $STX #STXGONZALES HARMONIC SHARK Dear friends , STX has Harmoinic Shark and descending triangle

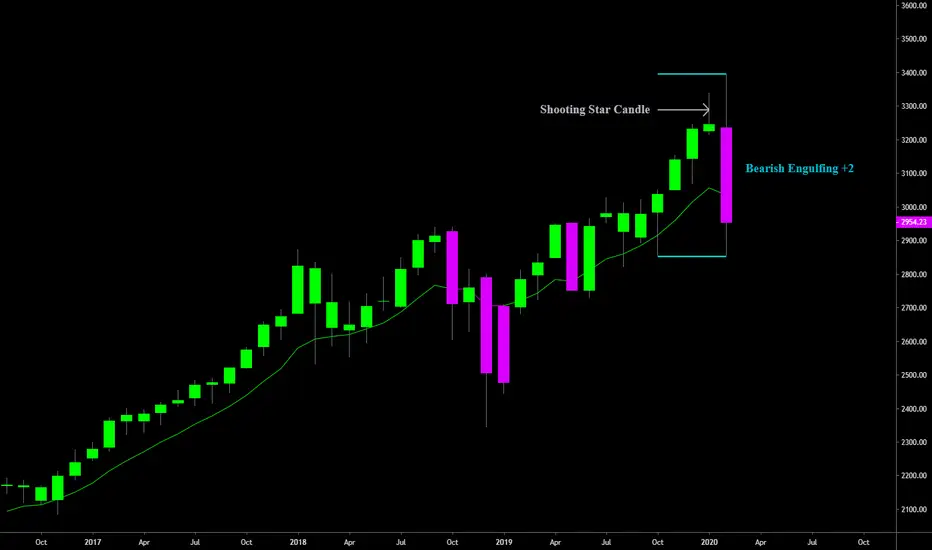
S&P 500 Bearish Engulfing+2 Following Shooting StarA closer look at the month of February shows that we had a bearish engulfing candle + 2. A bearish engulfing candle is one where the high of the candle and low of the candle completely engulfs the previous candles high and low(shown with blue lines) and indicates a potential reversal to the downside. The +2 indicates that the bearish engulfing candle not only engulfed the previous candle, but also engulfed the two candles before the preceding candle as well. February’s low was .10c above October 2019’s low which kept this from becoming a bearish engulfing +3. While this bearish engulfing candle on its own is bearish, a trend reversal isn’t confirmed until/unless we see a price move lower on the following candle(March 2020). If March price moves and closes lower than February’s low it can be viewed as a trend reversal and end of the 10-year bull market rally.
February’s bearish engulfing candle comes on the heels of a shooting star candle created in January of 2020. A shooting star candle is a bearish candlestick with a long upper wick with little or no lower wick. Shooting stars appear after an uptrend in price. The distance between the highest price of the candle(top of the upper wick) and opening price(top of the candle body) must be twice the distance of the candle’s body to be considered a shooting star; the upper wick must be twice the length of the candle body. Shooting star candles are most effective when they occur after a series of three or more consecutive rising candles, which this chart shows.
We now have two bearish candles on the chart with last months shooting star and this months bearish engulfing, both of which indicate that a top in price has likely been made.
AMD - rebound on the works?!AMD tested 41.20 which is both a minor horizontal support as well as a 100% fib extension. It is the strong rebound candle (long and engulfing) from there that is shouting a "buy!". Looking to scale out on the fib levels up or trail the stops. However should the market tank again (since this corona virus fear hasn't peaked), then I would be interested to long between 34-36 (major horizontal supports there)

BTC- Go lower in order to bounce higherHello traders!
Despite the 100 millions long liquidation and the drop of 10% open interest during the epic bull trap last week, the maximum selling pressure still seems far away.
The only way to go up is to dip down further in order to reach for more selling liquidity.
I believe we will continue to see more moderate supply runs follow by weak demand runs until strong limit sell orders and sell walls show up with the conviction.
Of course, not completely ruling out the possibility of the bull flag momentum run yet. Though unlikely judging by the weak daily buy volume.
Please click like and follow me if you find my analysis useful. Happy trading :)
Please do your own due diligence and research. My analysis is only my opinion, not the investment advice.
twitter.com


Trade Ideas Educator: USDCAD BatYes, this is an indicator on a testing phase, so yeah a Bullish Bat Pattern has setup, having the bullish engulfing candle and a long shadow cand that seems to lose the momentum I'm in on this counter-trend trade setup.
If you can spot it, a bearish shark pattern may form for a trend trading opportunity(short).
If you love to receive the levels, check out the link at (3)

Bearish Engulfing Pattern and Hidden Divergence confirm A bearish engulfing pattern can occur anywhere, but it is more significant if it occurs after a price advance. This could be an uptrend or a pullback to the upside with a larger downtrend.

XAU/USD TRADING PLAN FOR NOW I SEE PRICE ALREADY BREAKOUT UPTREND TRENDLINE . WAITING FOR PULL BACK AND ENTRY . I USING ENGULF AND TRENDLINE BREAKOUT FOR THIS SETUP . IF PRICE GOING UP TO SUPPLY ZONE WAIT FOR PRICE ACTION TO ENTRY .

GBPAUD LONGGBPAUD LONG
Overall TP - 120 Pips
I have highlighted three areas on interest where either bullish engulfing candle was formed or morning star doji candle.
Price is currently entering low consolidation.
I believe we will soon see some bullish movement.

GBPNZD SUPPORTThis is a good example of using support to your advantage when trading.
If you look at the two highlighted areas at support price created bullish engulfing candles.
It was a matter of time before price was going to take off.
Finally price slow down giving some consolidation this could be a potential entry for a buy.
Been able to secured an overall of 160 pips with only risking 30 pips.
This is just an example of how you can support or resistance and candlestick structures when you maybe unsure about a trade.

Short term pullback on AUDNZD, long term bullAs seen on the charts, on the short term (1D), it seems like AUDNZD is going to have a drawback, but on the long term (1W) chart, it looks like AUDNZD is going to continue the trend that has been developing for a while now - I don't see a reason to why it would break that trend.

ONTX Weekly engulfing candle w/rising volume!Alright folks, price needs to close today anywhere above .39 and we'll have an engulfing weekly candle. Currently, price is at .47 so it's looking great! Rising volume and weekly RSI on the rise, this name looking stellar for continuation. Congrats to the bulls who bought the dip down to .29!


CADJPY Short now! Perfect channelHello guys, let's look at this perfect bearish channel...
I recommend to short now, there has been an engulfing right now.

LTCUSD At The UTL With Bullish Engulfing CSFLitecoin looks almost identical to Ethereum,its at the up trendline with a bullish engulfing candlestick formation.
go back to my ETHUSD post to see more in depth why I like this setup

SILVER - Bullish Patterns Abound on Weekly ChartSilver's weekly candle charts have now thrown 3 bullish candlestick patterns in a row with a triple pin bar setup, and the final pin bar also acting as a bullish engulfing bar. This setup is offering an attractive risk:reward for a bullish upside breakout.

XAUUSD 4hr bearish butterfly and engulfing, hr supply short!XAUUSD just had a textbook harmonic patterns and reversal sign combination trade.
It hit the entry of the butterfly and gave an 4hr engulfing, which made me interested in this hr supply!
Waiting for the 1589 pullback to take some intra-day short,
let's see how it goes yo!

