Engulfing Candle

LTCBTC trendreversalWelcome fellow tradingviewers,
For the ones following me for a longer period of time we have mentioned a possible trendreversal on LTCBTC a couple of times.
After our last analyses we had a small fakeout to the downside with the miners capitulation sending the prices into one last dark hole.
Since then prices have returned to the mean and we are now getting even better signals.
So lets jump straight into analyzing shal we?
Monthly :
- A candle closure above 0.0065 is very likely to happen, this would indicate a bullish engulfing candle of the monthly which is a great indicator for further upside.
- The volume picture is also corresponding with the bullish engulfing, increase in volume + increase in price = upside potential.
- Next real resistance would be located around 0.008
Weekly :
- This weekly candle is also trying to become a big bullish engulfing indicating more upside to come.
- Weekly MACD crossed bullish which is a big thing (if you want to know why check our last analyses)
- Resistance located around 0.007
Daily :
- 5 candles ago we had a bullish engulfing candle indicating more upside, which seems to take place as of today.
- Daily closure above 0.0069 would mean that the 200 daily moving average has been overtaken, which would mean that the TREND has CHANGED !
So depending on the daily close of today you could state that the trend on LTCBTC has changed and that we are now once again looking to open long positions.
LTCBTC is soon getting its own ASIC miner which would make the mining of LTC become more profitable indicating that more people will start mining again.
So in summary:
We are really bullish on LTCBTC if we get a closure above the 200 (D)MA and a bullish engulfing on the monthly, then the trend is changed in our opinion and we could be in for a long lasting bullrun.
This analyses is only showing you guys our vision on LTC and should not be considered as financial advice. If you agree or find this analyses useful let us know in the comments below and don't forget to leave a Like !
Kind regards,
Forallcrypto

SPY - pullback before upward move, short term ideaHi Everyone,
An update on the SPY charts
Bulls have been full throttle and enthusiasm has been at its peak. A quick look on the charts, after a strong uptrend, we can see a Bearish engulfing pattern that has developed on the daily chart, this could be a sign of shifting hands of powers from bulls to the bears, at least momentarily. Also RSI already near overbought zone, a good case to go short for the short term.
On daily charts, next support level is 327.31 and 325.10 levels
On 4hr charts, support at 327.37 and 325.09
On shorter timeframe, 30m charts, support at 327.36, 326.81 and 325.19
Trust this helps
If you like what you see, share a thumbs up!
Cheers

USDNOK Jan 24, 2020We can clearly see the touch on the resistance and a clear rejection with the bearish closed candlestick (I am looking at my broker's chart which is a bit more accurate compared to this SAXO BANK). We can also see that the bearish (red candlestick) is bigger than the green which indicates a bearish engulfing pattern and therefor a reversal.
!!Another sign is the overbought position the pair is in and the bearish divergence we can see. I am waiting for a big move to the downside. And therefore I will short this pair!!
Disclaimer!
This post does not provide financial advice. It is for educational purposes only! You can use the information from the post to make your own trading plan for the market. But you must do your own research and use it as the priority. Trading is risky, and it is not suitable for everyone. Only you can be responsible for your trading.

SATRIX 40 - Bearish Engulfing candle- SATRIX 40 ended the week with a bearish engulfing candle (with volume)
- Looking for a move back to the 200ma for support

Bullish Move is about to happen in NZDCADI believe this pair NZDCAD will have a new bullish move but that will never happen until one condition satisfied which is the price should drop to 0.8639 and once that happened there should be either engulf bullish candle or bullish hammer formed which means that this level is more bullish than bearish.

BTC- Accumulation modeThis week is nothing but reverse bart patterns and scam wicks!
I guess this is the result of decreased liquidity caused by the slowly declining volume during the consolidation phase.
Bitmex is trading below 2 billion volume as of now, yet open interest is on the slow ascending trend. This tells me the accumulation is taking place possibly by big fishes.
In addition, volatility is slowly ticking up as well.
Other signs to pay attention to- CME open interest and volume going up + Backwardation + USDT premium going up
As we all now, low volume is a precursor to the high volatility move... As long as 8.4k is defended, I will continue my buy on the dip mode!

eur/jpy short possibilityeur/jpy broke previous support which has become resistance and is acting as supply zone due to bearish engulfing forming. Waiting for price to reach area of value so i can get better entry in going short.

{SWC}——KRONO, Bullish Engulfing!Thank you for your continued support :)
Strategy: Price-Volume Analysis
Bias: Bullish. KRONO has made a successful triangle breakout with volume today, after well supported on the uptrend line and short term MA line.
SWC's private group members were informed over the weekend that KRONO is reaching MA support zone and should take note!
KRONO has formed bullish engulfing candlestick pattern too.
SWC expects there will be more momentum generated following the breakout, where positive movement should be seen at near term.
S: 0.880, 0.865
R: 0.935, 0.950
If you found this idea helpful, do not be hesitant to leave us a like or comment! :)

EURJPY SHORT TRADE, BEARISH REVERSAL? 600 PIPS POTENTIAL!! Happy Monday everyone!!
After screening my chart this afternoon, i saw that there is interesting sell signal on Euro / Yen especially at the bigger time frame. Is it possible of the bear take in charge now? hmmm.. Might Be!! but lets take a look what information market currently gives us.
Monthly Time Frame
- Downtrend line potential 3rd touch
- Support breakout 128.803 currently on pullback
- Bearish Engulfing candle: Resistance at 123.318, Support at 120.008
- Sell signal identified
Weekly Time Frame
- Downtrend line potential 3rd touch (similar to monthly time frame)
- Support breakout 121.674 current on pullback
-Bearish Engulfing candle: Resistance at 123.357, Support at 121.259
- Sell signal identified
Daily Time Frame
- Support breakout 122.506
- currently price had already touch this support and move, creating engulfing bearish candle, this where i found my sell confirmation.
*ENTRY POINT EXPLANATION*
H4 Time Frame
- Lower low structure formed, 122.821 as high and 122.075 as our new lower low, breaking 122.212 as last week support.
- Double top formation formed at 122.821 as resistance, WAIT FOR PULLBACK to neckline 122.633, than we can good to sell
If this really monthly reversal movement than we might catch 600 pips more at last support 116.470
Thank you for looking at my analysis, this is my point of view on EUR YEN, whats yours? please let me know on the comment and i hope we can be friends ^^

AUDJPY - BEARISH We could see a push to the downside to retest this ascending trendline after AUDJPY failed to break resistance

EURAUD SHORT TRADE: 130 PIPS POTENTIAL (SWING TRADE) SETUP CONFLUENCE
Monthly Time Frame
- Support breakout, Pullback and possibility for bearish continuation
Sell Signal
Weekly Time Frame
- Support breakout 1.61597, pullback and possibility for bearish continuation
- Bearish engulfing candlestick formed, range = 1.63132 - 1.60322
Sell Signal
*SELL SETUP EXPLANATION*
Daily Time Frame
After looking at monthly and weekly time frame I conclude that price are on the way for bearish continuation. But the question is, where we might put our sell entry point??
inside weekly time frame bearish engulfing zone, we identified that at daily time frame, support has been formed and breakout. so this is where my confirmation for this sell setup.
H4 Time Frame
This is the part where i look for my entry point.
you can see that support breakout formed and inside those there was engulfing candle at price range: 1.61751 - 1.61274
i will put my sell entry point in that zone, still confuse ?? if yes than put your sell entry point at 50% level in the engulf zone. 1.61508
Keep it simple guys!! ^^
This is my thought on EUR / AUD for this trading weeky, what's inside your mind? please let me know in the comment. Thankyouuu!! :D

Trade Ideas Educator: AUDCAD BatThis bearish bat setup is 1 of my favourite for this week and that's because on the daily chart Point X to Point A is the move that breaks a few small support level. Although if the market break lower and close lower it will be even better, this is something I can't complain about.
This trade may enable me to have a trade extension on a trend following setup. A break and close below point A will ensure that to happen. Let's see how this trade goes.
Well if you are searching for help and a community, have a look at the links on my signature, hope to see you soon in our TIP community.

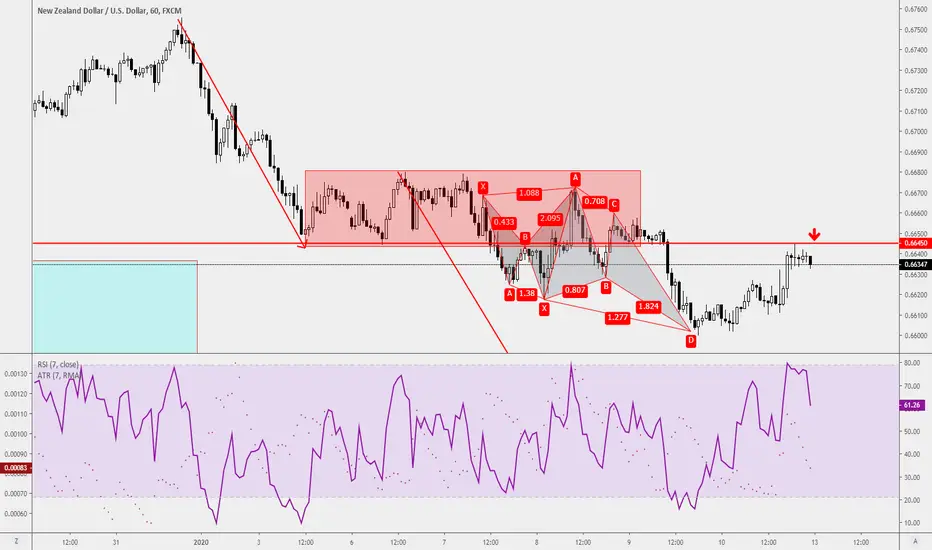
Trade Ideas Educator: NZDUSD ResistanceLooking to short at the resistance(red line), yes, just that. The bearish flag pattern has confirmed after a break and close below of the pink box, looking for trade extension towards the downside. A double top or a retracement after a bearish engulfing candle will enable me to engage this trade.
ETHUSD - Plethora of Bullishness on Daily CandlesticksIn this video I look at a few of the bullish price action patterns that have formed on the daily charts including bullish engulfing bars, 2 bar reversals, and a 1-2-3 reversal pattern.
As a side note: I am going to try and keep future videos at 5 minutes or less. I didn't quite hit the mark with this one but am doing a lot better.


Just started! Bullish engulfingBULLISH ENGULFING KEY CRITERIA
1: Market must be in a clearly defined downtrend...done
2: The first candle is bearish...done
3: The second is bullish...done
4: The bullish candle engulf the previous candle's body...done
We have an important signal reversal signal !
Stay tuned for more updates , don't forgot to follow me to stay up to date ;)

GBPJPY 15M SCALPING US SESSION INSIDE CANDLE BREAKOUT STRATEGYINSIDE CANDLE STRATEGY
What is an Inside Candle
1. Previous candle engulfs next candle.
2. 2nd candle high is lower that 1st engulfing candle.
3. 2nd candle low is higher than 1st engulfing candle.
INSIDE CANDLE METHOD
1. Incoming Trend
2. Inside Candle – Opposite Color
3. Enter Break of Engulfing Larger Candle
Inside Candle method is a great short term consolidation indicator.
If your trade plan contains breakouts and consolidation then this method is for you.
This is a great way to find smaller consolidations quicker which will give you more trades on whatever time frame you want to look.
On a daily chart it may take weeks for a consolidation pattern to form.
An Inside candle represents a pause, consolidation or compression in the market after a big move.
Often you will also see reduced volume on the inside candle.
Inside Candle method is a pause or a reversal of the trend . So it is more effective if there is an incoming trend.
Enter a break of the larger engulfing candle in the direction of the break.
Enter with a Stop Order a few pips above or below breakout level.
Which trades you take is a matter of preference.
Some like reversal trades or trend following trades.
Scalping inside candle pattern doesn't matter what direction you may go.
Trend following you will want to see this in context of a larger trend.
Take all the trade setups and just shut down the ones that don't preform.
Trade Management: Enter 2 trades
Stop Loss is 1.5 x ATR for both trades
First Take Profit is 1 x ATR for 1st trade
2nd trade there is no take profit.
When 1st TP is hit move 2nd trades SL to breakeven.
Let profit run on 2nd trade by following/trailing SL.
If a candle closes back inside the larger engulfing candle close down trade.
Watch for a setup for the next breakout.

EURNZD - Week 06/01/2020 - almost a Bullish EngulfingAlmost a Bullish Engulfing
Entry @ 1.67576
TP @ 1.69405
SL @ 1.66190

EURAUD - Week 06/01/2020 - Bullish EngulfingPotential Bullish Engulfing
Buy @ 1.60670
TP @ 1.62560
SL @ 1.59440

BTCUSD - Bullish patterns forming. Potential bottom?Even while bitcoin has been consistently dropping from one support level to the next, there are some bullish price action patterns that have been forming over the past week. Firstly, price is sitting on a critical support trend line on the log chart that goes all the way back to early 2015. Off of this key support level two large bullish engulfing bars have formed. We will need to see price push higher from these patterns and hold above the important $7,700 resistance to have any hope that a bottom is in. This market has a lot to prove but these bullish patterns are a good start.

Bearish Engulfing 4h CandlestickBearish Engulfing 4hr Candlestick EUR/USD and start of crossing in VFI_LB indicator.
Vwap for entry in 1.22 target below 1.18 support.
Divergence and convergence pattern in indicator and candlestick.
Increase volume for bear in the currency.

BTC Core Macro Continues Downward SlideExcited by the reaction off of that 6.4k touch, much of the crypto community has grown horns, and become bullish again. I understand it. I even hope(d) it was a nice strong reversal beginning. The Weekly tells a much more grim story.
A) Chikou has been rejected by the cloud.
B) Chikou has now traveled below price, as well as below T&K
C) In late Oct we formed an Engulfing candle. So far we've only resolved it to the downside (arrow) Holding that yellow block is important for Bulls to keep their "Reversal" hopes alive. The "Never below 6k again" crowd will get their answer if/when we test that block.
D) Look left......That Looooong.....Straight Cloud......Think it'll get a reaction? ::wink::
Bulls need to regain 7.3-7.5 to keep their hopes alive, imo. LHs LLs continue to be the reality. Perhaps we play an Edge-To-Edge on that Cloud, and tap 4.5k or so before making HL's and HH's ::wink::
