Trade Idea: AUDSGD — Bearish BatPattern: Bearish Bat
Reversal Candle: Bearish Engulfing
RSI: Overbought
Engulfing Candle

EURUSD 1H INSIDE CANDLE METHOD BREAKOUTINSIDE CANDLE STRATEGY
What is an Inside Candle
1. Previous candle engulfs next candle.
2. 2nd candle high is lower that 1st candle.
3. 2nd candle low is higher than 1st candle.
INSIDE CANDLE METHOD
1. Incoming Trend
2. Inside Candle – Opposite Color
3. Enter Break of Engulfing Larger Candle
Inside Candle method is a great short term consolidation indicator.
If your trade plan contains breakouts and consolidation then this method is for you.
This is a great way to find smaller consolidations quicker which will give you more trades on whatever time frame you want to look.
On a daily chart it may take weeks for a consolidation pattern to form.
Inside candle represents a pause, consolidation or compression in the market after a big move.
Often you will also see reduced volume on the inside candle.
Inside Candle method is a pause or a reversal of the trend . So it is more effective if there is an incoming trend.
Enter a break of the larger engulfing candle in the direction of the break.
Enter with a Stop Order a few pips above or below breakout level.
Which trades you take is a matter of preference.
Some like reversal trades or trend following trades.
Scalping in doesn't matter what direction you may go.
Trend following you will want to see this in context of a larger trend.
Take all the trade setups and just shut down the ones that don't preform.
Trade Management: Enter 2 trades
Stop Loss is 1.5 x ATR for both trades
First Take Profit is 1 x ATR for 1st trade
2nd trade there is no take profit.
When 1st TP is hit move 2nd trades SL to breakeven.
Let profit run on 2nd trade by following/trailing SL.
If a candle closes back inside the larger engulfing candle close down trade.
Watch for a setup for the next breakout.

100 point drop ahead?GMAB
We are here again, fifth time we hit the upper band of the paralell ascending trend channel, the prior 4 times it made a spinning top and bearish engulfing before heading down. That's pretty much what we can see again, spinning top followed by bearish engulfing.
GMAB, recently broke out of the big overhead resistance from the former triple top, which was formed in 2017. It would be likely that GMAB takes a breather after 8 weeks of green and a bit overextended. It could take a small dive and revisit 1485 and enjoy the view from the former top and bounce back from there.

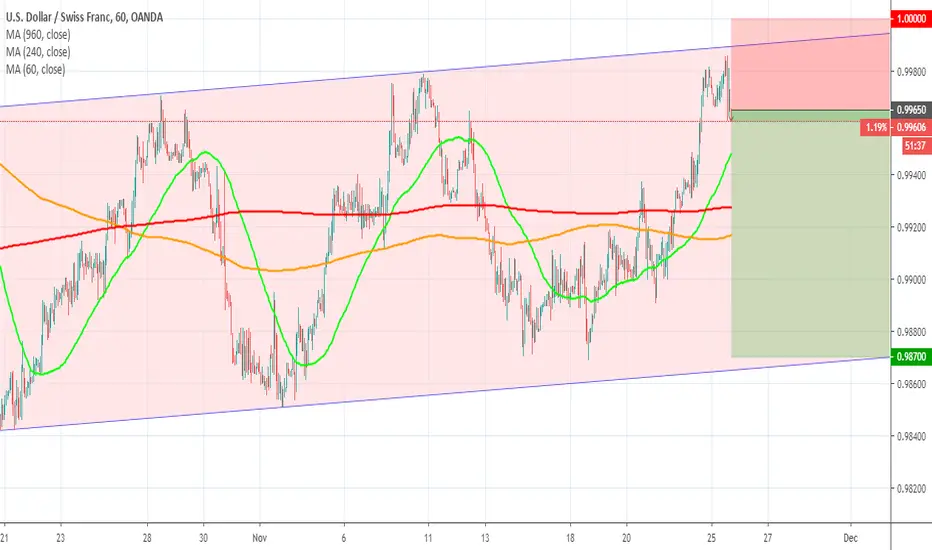
USDCHF rejection on the up-channelUSDCHF reached the top of an ascending channel that we've been monitoring for the past 2 weeks.
Sellers had a nice reaction, with a shooting start, followed by a bearish engulfing pattern.
Risk to reward ratio is very good for this trade, so it's worth a try.
A complete analysis of it is available on my last video on my YouTube channel.
AMBUJACEM LOOKING BEARISHAmbujacem trading in a triangle pattern and made bearish engulfing candle
BELOW 214 MAY TARGET 197--190--185

Trade Ideas Position: CADJPY BatA type2 Bearish bat setup has occurred, this time round with the arrow indicator from my Harmonic Pattern Assistance software. If the current candle has a bearish engulfing, I will engage this trade.

CHOLAFIN... BEARISH SANDWICH.. Cholafin given breakdown from the channel after making bearish sandwich & bearish engulfing candle
short for target of 300--290

GOLD Bullish Continuation Set UpWaiting for a proper exhaustion of price action after an engulfing reversal.


EUR/USD – Bearish Engulfing Candlestick on The Weekly Chart.On the weekly chart, we can see how the candle from 2 weeks ago has ended as a bearish engulfing candlestick.
It indicates that the long term bearish momentum is still continuing.
On the H1 chart, we can see a fresh supply above which is a great level to sell and join the long term bearish momentum.
I'll sell at this supply and the target will be 1.0700 zones.

GBPJPY Bounced at SupportSTRATEGY: S&R Trading Strategy
(1247)
Analysis
1D: Price still moving inside a well-defined range
1H: Looking at 1H TF, a Hammer was created and it was followed by Bullish Engulfing which act as our ETs
See previous post for more details:
Action Item(s)
- Scale-in as necessary
Note: This post is for my personal journal/personal opinion only. Please trade at your own risk

USDCAD Support and Resistance Trading StrategySTRATEGY: Support & Resistance Trading Strategy
DETAILS
Analysis TF: 4H/1D
Focus TF: 1H
SL: Just above Bearish Engulfing (0.5ATRC on 1H TF)
AOV: Resistance Zone
1D Analysis
MC: Sideways - Price bouncing inside Horizontal Support and Resistance
4H Analysis
Price struggles to create a new High, forming a Bearish Engulfing (not yet closed - but it is a high momentum candlestick)
1H Analysis
ET: Bearish Engulfing - Confirmed Bearish Engulfing occurred on 1H TF.
Will scale in if price bounced on Support or on 10EMA, 83/100EMA or 200EMA at 1H TF
Will scale in if price bounced on Support or on 10EMA, 83/100EMA or 200EMA at 1H TF
Note: This post is my personal journal/opinion only. Please trade at your own risk.
#ExcellentTrade #BearishEngulfing #SupportandResistance #MovingAverage

GBPJPY Support and Resistance Trading StrategySTRATEGY: S&R Trading Strategy
ID: 1209
Analysis TF: 1D
Focus TF: 1H
AOV: Minor Resistance Area
ET (1H): Bearish Engulfing
CP: Ascending Channel
1D Analysis
MS: Sideways - Price is moving in a range
1H Analysis:
CP: Ascending Channel - Price is moving inside the Ascending Channel. However, price failed to break above minor resistance of 140.597. It also looks like price made a pullback under the Ascending Channel.
Price closed with Bearish Engulfing which act as our Entry Trigger (ET).
Short Position
SL: Just above the Minor resistance (140.618)
TP: 2.19R - Just before Major Support
Note: This post is my personal journal/opinion only. Please trade at your own risk.

CADJPY Ascending/Descending Channel Support Zone ConfluenceSTRATEGY: Chart Patter/S&R Strategy (Ascending and Descending Channel)
Focus TF: 4H
TP Target: 2.04R
ET: 1H - Abandoned Baby; Bullish Engulfing
AOV: Ascending and Descending Channels' Support Zone (Confluence)
1D Analysis:
Long Term - Price moving inside a large Ascending Channel.
Short Term - Inside Ascending Channel, there's a Descending Channel and the price approached both Large Ascending and Descending Channels' Support Zone.
Pin Bars occurred on the Support Zone showing rejection of the area. There is a high probability that the price will bounce and hit the Major Resistance (Horizontal) area.
4H Analysis:
Price struggled to create a new low, showing mini consolidation and price rejection of the Support Zone
1H Analysis:
ET:
- Abandoned Baby
- Bullish Engulfing - Series of Bullish Engulfing occurred on 1H TF. These are a great sign that price is ready to bounce and go up.
Note: This post is my personal journal/opinion only. Please trade at your own risk.

Largest Engulfing Candle I have ever seen! 64 Candles!!!I noticed this on the 15 minute chart today as I logged onto my system. Does this mean we are about ot have a huge drop in USOIL price?

EUR/USD Short SetupPrice is facing resistance at the 1.1060 level and a bearish engulfing pattern has been confirmed. If this sort of setup meets anyone's trading plan this is how It would look.
Entry --> 1.1060
Stop Loss ---> 1.1070
Take Profit--> 1.1040
Risk/Reward -->2.0
Please Comment, Like, & Follow!
This information is not a recommendation to buy or sell. It is to be used for educational purposes only.

NZDCAD Ascending Channel Counter-Trend StrategySTRATEGY: NZDCAD Ascending Channel Counter-Trend Strategy
DETAILS
Long Term Trend Time Frame: 1D/4H
Focus Time Frame: 4H
Entry Time Frame: 1H
Market Condition
Long Term: Downtrend (based on 1D TF/200EMA)
Short Term: Uptrend/Consolidation (based ion 1D TF/10EMA and 50EMA) inside Ascending Channel
CHART PATTERN: Ascending Channel
Area of Value (AOV)
RESISTANCE
Static: 0.85201 - 0.85075
Dynamic:
83EMA: 0.84701
100EMA: 0.85002
SUPPORT:
Static:
Minor: 0.83774 - 0.83683
Major: 0.83385 - 0.83158
Dynamic:
- 10EMA: 0.84220
- 50EMA: 0.84146
ENTRY TRIGGER(s):
1H: Bearish Engulfing
4H: NA
1D: High Momentum Candlestick going to Resistance
Entry Price (EP): 0.84759
Stop Loss (SL): 0.84953
Take Profit (TP): 0.84059
RRR: 4.02
ANALYSIS
1D - Overall trend is showing downtrend based on 1D TF - 200EMA. Heikin Ashi is still uptrend but the price is currently struggling to break above resistance level of 0.85201 - 0.85075. It is also supported by 83EMA and 100EMA which act as Dynamic Resistance.
www.tradingview.com
4H - Looking at the 4H TF, we can see that Price is moving on an Ascending Channel. Short term trend showing uptrend which is supported by Heikin Ashi. However, as stated before, the price is currently struggling to break above Static and Dynamic Resistance on a higher Timeframe (1D). We will give more weight on a higher timeframe as Smart Money focuses on this time frame.
www.tradingview.com
www.tradingview.com
1H - Our Entry Triggers are always on 1H TF. Here we see that there's a Bearish Engulfing Price Action happened on the Static Resistance AOV. This acts as our Entry Trigger.
www.tradingview.com
www.tradingview.com
OTHER ENTRY REASON(s):
High Momentum price action approaching resistance usually reverses as it has no higher highs to support its move.
ACTION ITEMS:
1. Exit/TP on Higher Timeframes: 4H or 1D
2. Scale in on Entry Timeframe (1H).
IMPORTANT:
Always move the SL on Breakeven after significant move.
Scale in as necessary and move the TP of the initial entry to the SL of new entry. This way, we will be able to Minimize risk and Maximize potential Profit.
NOTE: This post is for my reference/journal purposes only. Trade at your own risk.

USDCAD False Breakout?
STRATEGY: False Breakout Strategy/Counter-Trend
Long Term Trend Time Frame: 1D/4H
Focus Time Frame: 1H
Market Condition 1D:
Short Term: Downtrend (based on 100ema)
Long Term: Sideways
Market Condition 1H:
Short Term: Sideways
Long Term: Uptrend (based on 100ema)
Area of Value (AOV)
Resistance: 1.32915 - 1.33813
Support: 1.31118-1.30205
Entry Trigger:
1H: Bearish Engulfing
Entry Price (EP): 1.32216
Stop Loss (SL): 1.32426
Take Profit (TP): 1.31234
RRR: 4.68
Analysis:
1H: Price boke above minor resistance but immediately followed by bearish engulfing. Found support at descending trendline, however, price seems struggling reaching new high (pin bar was also formed rejecting higher price). These could be a sign of False Breakout.
NOTE: This post is for my reference/journal purposes only. Trade at your own risk.

NZDUSD - FURTHER DOWNSIDE ?NZDUSD on the weekly timeframe looks to create a closing bearish engulfing candle.
With data from the US still topsy turvy / if, but, maybe a trade deal, then the uptick in NZD may have to wait a while until it finds buyers at a lower level around the 0.6090 August 2015 spike.
Trades to the long side of NZD are increasing but the strength in USD may well keep it subdued. Maybe look to trade it against a weaker currency ?
Keep a look out next week on the price action to see if NZD drops below previous structure lows for clues to see how much further the downside will be.

FKLI - No Sign of Slowing Down/ More Bullishness ForwardFKLI - Bullish engulfing candle pushed above upper BB, MACD & RSI continue to stay bullish. Upward momentum persists. Resistance at 1,619


EURCAD Support & Resistance TradingSTRATEGY: Support/Resistance Trading Strategy
Focus Time Frame: 1H
Long Term Trend Time Frame: 1D/4H
Market Condition: Ranging
Area of Value (AOV): Resistance (Price at Resistance Zone) 1.47387 - 1.46936
Entry Trigger:
1H: Bearish Pin Bar
4H: Bearish Engulfing
Entry Price (EP): 1.46725
Stop Loss (SL): 1.47432
Take Profit (TP): 1.44753 (2.79R)
Analysis:
EURCAD is currently at a ranging market condition as we see clearly on the chart. Looking on the 4H Time frame, we can see that price rejected the Resistance Zone with Bearish engulfing. On 1H Time Frame, the zone got rejected with 2 bearish Pin Bars. Prior to these, we can see that the price approached the Resistance Zone with High Momentum. This usual type of move approaching either Support or Resistance Zone usually indicates trend reversal.
OANDA:EURCAD
DISCLAIMER: This post is for my reference/journal purposes only. Trade at your own risk.

GBPUSD - LONG - Possible 82 pips!!!Trading session? = London
Type of Entry? = Bullish Engulfing
RRR? = 1:3
S/L = 23 pips
Possible minor T/P? = Yes @ 1.29260
Check 4HR + Daily for trend direction? = Yes, bullish
Reviewed notes? = Yes
