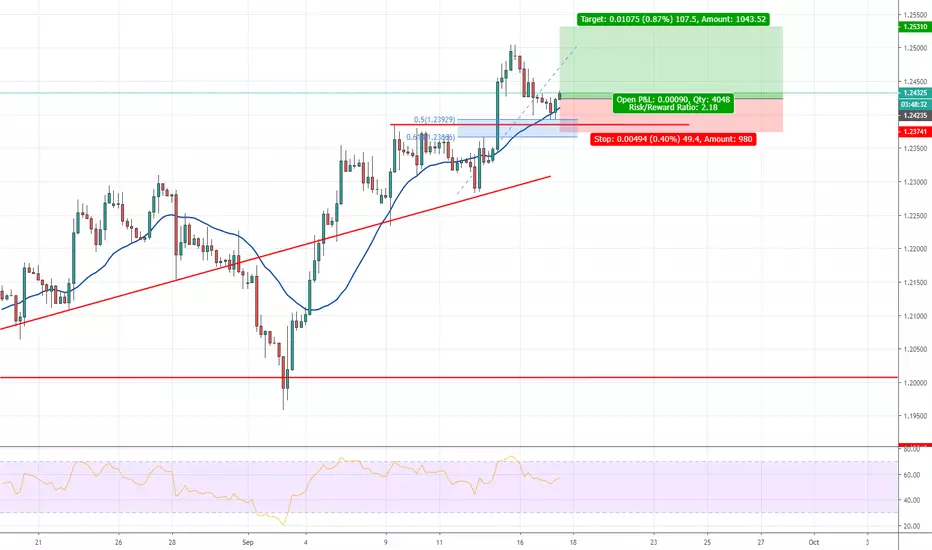
Bearish engulfing barThere are a few factors in play with this setup. The pin bar striking the moving average on the weekly time frame around resistance indicates a bearish signal from price action:
H4 has a few clear characteristics that is classic of a bearish setup:
1. Bearish engulfing bar
2. Pinning moving average
3. Pinning fibonacci 50% pullback level
When the above is kept in mind after the bullish structure broke down (trend line broken) there are many factors meeting in confluence signalling the bears. For this type of setup the stops are best placed a few pips above the high of the engulfing bar and the target must be at least 2x that of the risk. The initial target can be seen as provisional while the 660 pip mark from the entry point is a likely secondary target.
Don't invest what you can't afford to lose. This is not investment advice. Subjective view/report of a financial product only.
You can learn price action trading at no cost. Join my mailing list to receive more information zc.vg
Join me in Forex Bootcamp for live updates using the link below.
DISCLAIMER
All information published within this website is purely for educational purposes and offers no guarantees. Profit Fx, Forex Bootcamp and any of its associates cannot be held responsible for any trades that you have executed in any way whatsoever. Please familiarize yourself with the relevant risks involved when trading forex, CFD’s and other products. Any trading is done solely at your own risk. Profit Fx, Forex Bootcamp and any of its associates are in no way employed by any broker or any other legal entity. All information published within this website does not constitute advice, but rather objective information about a financial product and analysis or report of a financial product.
Engulfing Candle

EURGBP trading the rejection on the down-channelEURGBP getting again in the upper part of the down-channel, giving us another opportunity to plan our short position.
There is a bearish engulfing pattern right on the top of the channel, so we can enter right now and play with a very good risk to reward ratio.

AUDUSD resistance to hold?AUDUSD just tested a resistance that is formed by the last important swing high. After testing that level, we had a bearish engulfing pattern, sign that sellers are attempting to push the price down.
Interesting battle between buyers, who seemed to be strong with the last up-movement, and sellers, who seem to find convenient the level 0.6808 to place their short positions.

EURAUD bullish engulfing pattern pushing the price up?EURAUD is in a short term pennant and we just had a bullish engulfing pattern at the bottom of it.
With a risk to reward ratio that is better than 1:2, this could be a nice trade to catch!

Engulfing bar on Fibonacci level1. Up trend
2. Pullback to fibonacci level
3. Engulfing bar completed
4. 50 sma pinned (confluence)
This type of setup entails that the stop placement be a few pips below the engulfing bar and the target level must be at least 2x the risk (sl)
Don't invest what you can't afford to lose. This is not investment advice. Subjective view/report of a financial product only.
You can learn price action trading at no cost. Join my mailing list to receive more information zc.vg
Join me in Forex Bootcamp for live updates using the link below.
DISCLAIMER
All information published within this website is purely for educational purposes and offers no guarantees. Profit Fx, Forex Bootcamp and any of its associates cannot be held responsible for any trades that you have executed in any way whatsoever. Please familiarize yourself with the relevant risks involved when trading forex, CFD’s and other products. Any trading is done solely at your own risk. Profit Fx, Forex Bootcamp and any of its associates are in no way employed by any broker or any other legal entity. All information published within this website does not constitute advice, but rather objective information about a financial product and analysis or report of a financial product.

#DNT : Upto 150% Profits For The Mid Term#Accumulatio_Recommendation
Pair : #DNT / #BTC
Trading Platform : #Binance
RSI : 59
TA Notes :
- MACD : Looking bullish on the daily chart.
- RSI : Looking bullish too for the short the short term being in a neutral position form but going to move towards the overbought area in the mean time.
EMA : Already below the price level indicating a good reversal bull trend.
- Volume : Trying to have energy at the current 1D chart by the past 2 days and if it can continue like it is performing right now like almost many altcoins are doing it can be considered as a strong indication for a reversal move.
- Candl Stick formation is also looking very good at the moment continuing the formation of a bullish engulf candle from yesterdays close.
#Accumulation_Zone : 65 sats - 75 sats
Distribution_Zone:
Target 1 : 82 sats
Target 2 : 91 sats
Target 3 : 97 sats
Target 4 : 110 sats
Target 5 : 123 sats
Mid To Longer Term Targets
Target 6 : 141 sats
Target 7 : 151 sats
Target 8 : 163 sats+
STOPLOSS : Close below 56 sats
Risk : High
Capital Accumulation : 3%
@TogetherWeAccumulate

USDCHF Sell IdeaD1 - Price has reached the top of the range.
H4 - Multiple divergences, false breaks and nice engulfing candle pattern.
We may look for possible sells with bearish evidences as long as the top of the daily range holds.

AUDJPY - Engulfing on Supply Level - SELLHello traders,
I found a supply level that was hit last week. The price is currently in a consolidation.
I waited for a confirmation (candle formation) before entering the trade. The confirmation was a engulfing candle on the D1 Chart.
I'm uploading this idea after I actually entered the trade. The SELL trade is still valid. Eventually you can get the same entry with a limit order.
Always remember to trade with proper money management.
I recommend a maximum risk of 2%.


USDCAD Weekly Showing Strong Bearish SignsDollarCad Weekly Formed A Bearish Engulfing CandleStick Formation after breaking out of its long term channel,
USDCAD already retraced back up creating a lower high and now we have this bearish candlestick formation with a counter trend line break.
the daily seems to be a little low already and might retrace, I don't plan getting out since its the beginning of the move from the weekly, what Im planing to do though if it retaraces on the daily I might look to add to my position.
if you not in yet I would say probably the best thing to do is to wait for a pullback, Risk Disclaimer I'm not telling you what to do im just saying what I would do.
I Wish You To Make Lots Of Money

Price action buy signalThis is an awesome setup:
1. Resistance broken
2. Tested as support
3. Bullish engulfing bar
4. Moving average and fibonacci confluence (50%)
Best way to calculate stop is where the setup is deemed invalid and the target must be at least 2x that of the risk.
Don't invest what you can't afford to lose. This is not investment advice. Subjective view/report of a financial product only.
You can learn price action trading at no cost. Join my mailing list to receive more information zc.vg
Join me in Forex Bootcamp for live updates using the link below.
DISCLAIMER
All information published within this website is purely for educational purposes and offers no guarantees. Profit Fx, Forex Bootcamp and any of its associates cannot be held responsible for any trades that you have executed in any way whatsoever. Please familiarize yourself with the relevant risks involved when trading forex, CFD’s and other products. Any trading is done solely at your own risk. Profit Fx, Forex Bootcamp and any of its associates are in no way employed by any broker or any other legal entity. All information published within this website does not constitute advice, but rather objective information about a financial product and analysis or report of a financial product.
DLF | HARAMI CANDELSTICK PATTERN | BUY FOR SHORT TERM (WEEK)HEY FRIENDS, TODAY AS WE CAN SEE THE CLEAR HARAMI PATTERN WAS SEEN AND SO WE MAY SEE SOME BULLS I WITHIN A WEEK.

EURUSD Long counter trendAmazing trading activity today.
I got out of my short on EURUSD with 2R profit as ECB lowered interest rates to be even more negative.
Absolute madness if you ask me, but I will trade it happily, while I buy physical could.
Anyway, right after I was out of the trade EURUSD rallied higher forming a huge engulfing candle.
I will be looking to trade this countertrend entering on the 50% retrace of the candle.
Fundamentally lower interest rates should mean downward pressure on the euro, but then again, it is total madness.
I trade it as I see it. The fundamentals may play out over a longer period.
Date Pair Direction Trade Trend Level Signal Entry
2019-09-12 EURUSD Long Counter Trend Down Static Engulfing retrace

GBPCAD
Breakout from trend.
Large engulfing bull candle.
We'll check for a entry point before market opens.

EURUSD bullish engulfing pattern on a rejection levelEURUSD broke an important level of resistance this morning. The price is testing the same level and buyers reacted forming a strong bullish engulfing pattern right on the previous level of resistance. Easy setup with this trade, with a standard stop loss below the candlestick pattern and take profit above the previous swing high.

Price action short signalI like this setup because the swing low to the left provided a level that gave the bearish engulfing bar significance. This looks like a well positioned short trade set-up given that the moving average is also playing a role in the failure of the bulls to push the market back up.
This type of setup entails that the best position for stops to be above the engulfing bar and moving average where this setup would be deemed invalid.
Targets are calculated at min 2x SL value and/or the next support level
Don't invest what you can't afford to lose. This is not investment advice. Subjective view/report of a financial product only.
You can learn price action trading at no cost. Join my mailing list to receive more information zc.vg
Join me in Forex Bootcamp for live updates using the link below.
DISCLAIMER
All information published within this website is purely for educational purposes and offers no guarantees. Profit Fx, Forex Bootcamp and any of its associates cannot be held responsible for any trades that you have executed in any way whatsoever. Please familiarize yourself with the relevant risks involved when trading forex, CFD’s and other products. Any trading is done solely at your own risk. Profit Fx, Forex Bootcamp and any of its associates are in no way employed by any broker or any other legal entity. All information published within this website does not constitute advice, but rather objective information about a financial product and analysis or report of a financial product.

AUDUSD end of an uptrend?Yesterday, I published a potential trading idea on AUDUSD, on my YouTube channel.
The price is following an ascending triangle, but recent action is showing that sellers are getting stronger and may attempt to break the ascending triangle, pushing the price down.
There has been a nice reaction at the top of the triangle, then a double top (highlighted with the two red arrows) and a bearish engulfing pattern right after the second top.
This is only an analysis of a possible change of scenario. I'm not going to open any trade because the setup of the moving averages shows that it is not convenient to plan short positions, at the moment.

USDCAD to continue the downtrend#USDCAD to continue the downtrend after the formation of a bearish engulfing pattern that is pushing the price below a previous significant swing low.

Trade Ideas Educator: NZDJPY TrendlinesYes, both trendlines are pointed at different directions but you can see how similar it can be based on my analysis.
First, we have to register the fact that the trend on the 4-hourly chart is still bearish and the market is within the sell zone. I am waiting for a shorting opportunity.
So a bearish engulfing might just set up well for me to engage a short trade. If that didn't happen, I would just need a break and close below the bullish trendline on the left, a break and close below the trendline will set off a short position.

AUDUSD Long on bullish engulfer on supportDate Pair Direction Trade Trend Level Signal Entry
2019-09-03 AUDUSD Long Counter Trend Down Horizontal Support Engulfing retrace

EURGBP Uptrend ContinuationPrice action analysis identified potential EURGBP uptrend continuation and long opportunity. Bearish engulfing candle trigger, confluence with; horizontal resistance, 62% fib and 89 WMA.

Time To Change The OilAZO Has the appearance of having completed its leg up, and still has room to move downward toward 888 area in my opinion. Below are multiple timeframe looks at possibilities of this look like. Weekly chart would appear to be presenting AZO in a possible first wave in a longer term view. On the daily, printed a big fat huge bearish engulfing candle last Friday. Sww attached image. Pretty self explanatory after that. Happy hunting and GLTA!! commodity.com

Bitcoin USD Entry Review As described on the previous idea Bitcoin has hitted a strong support level.
Here is a example what it would of been a great entry.
On the 1 hour TF the market had given us a Bullish Engulfing candlestick formation with a increase in volume and after that the market went up.
Alway wait for the right entry.
Here it was:
1) Bullish Candlestick Formation
2) Increase In Volume
3) Daily Support
