BTC/USD WEEKLY SHORT, LONG-TERM.BTC/USD WEEKLY SHORT, LONG-TERM.
The bearish engulfing is one of the most important candlesticks
patterns.
This candlestick pattern consists of two bodies:
The first body is smaller than the second one, in other words, the
the second body engulfs the previous one.
This is how a bearish engulfing bar pattern looks like on your charts,
this candlestick pattern gives us valuable information about bulls and
bears in the market.
In case of a bearish engulfing bar, this pattern tells us that sellers are
in control of the market.
Engulfing Candle

Weekly EUR/USD short MACD shows that bears are taking over the bulls. There is a false breakout following by a bearish engulfing bar.
This is how a bearish engulfing bar pattern looks like on your charts,
this candlestick pattern gives us valuable information about bulls and
bears in the market.

#XVG : Up to 300% Profits Opportunities For The Mid Term.#Accumulation_Recomendation
#XVG / #BTC
Accumulation Area : 63 sats - 66 sats
Distribution Areas
Target 1 : 78 sats
Target 2 : 93 sats
Target 3 : 106 sats
Target 4 : 118 sats+
Stop Loss : 55 sats

GROW Double BottomDowntrend over last few weeks may be over as todays bullish engulfing shows signs of reversal. Watch for break of 0.35 to confirm bull break from falling wedge. Close above 0.35 would also be a hammer on the weekly chart. Good buy right now with strong support at 0.30, price target at recent tops of 0.51, potentially higher with any good news releases.
Upcoming catalysts include new contract signings, approval for use of technology on cannabis and more agro-industrial partnerships.

Bullish gbpusd for 100 PIPS!engulfing candlestick - daily
H&S - daily
break and retest of consolidation - 4hr
break and retest - 2hr + engulfing candlestick.
momentum bullish since the EURO is melting currently .


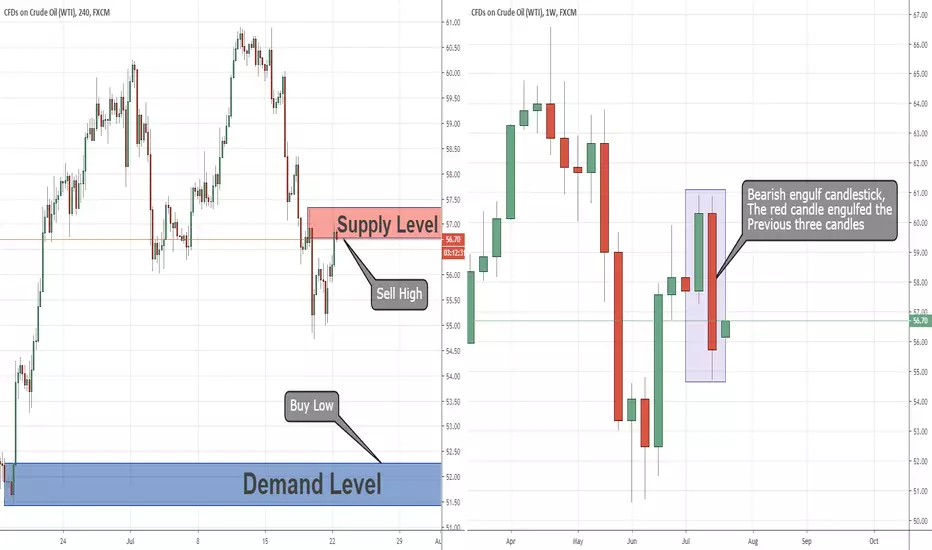
Bearish Engulf Candlestick For USOIL in W1 Time FrameDespite The “Ships War” in Strait of Hormuz, USOIL Keep Falling Down
In the W1 chart on USOIL, the last candlestick ended as a bearish engulfing candlestick which engulfed the three previous bullish candles.
We can see how the big red candle on the picture closed below the low of the three previous bullish candles.
That bearish Engulf Candlestick is a signal to look for a sell position on USOIL.
In the H4 chart, we can see the fresh supply above at 56.60 zones.
This fresh supply can be a great continuation level for a sell position.
If the price retraces the fresh supply above we can sell there.
The target for this sell position will be the demand below which also a great level for buy position.
A few days ago, Iran seizes a British ship in the Strait of Hormuz.
The situation between Iran and western countries is very explosive these days.
If the relationship between Iran and western countries will keep roll down it can really lead to war.
So, although the fresh supply above and the engulfing bearish candlestick, we should be really careful while selling USOIL.
If the relationship will roll down between Iran and western countries, the USOIL price might fly up and all this technical analysis will become irrelevant.
PARALLEL CHANNEL with Horizontal Support Resistance LevelBreak and Retest of Support Resistance Line. Trade consistently using Price Action. All that is needed to Trade Forex is Horizontal Key Levels (Horizontal Support and Resistance Levels).
Trade consistently using Horizontal Support and Resistance Level with a technical chart pattern like the Pennant, Rising/Falling Wedge, and Ascending/Descending Channel.
Trade consistently using Horizontal Support and Resistance Level with a candlestick pattern like the Pin Bar and the Engulfing Bar Candlestick.
Trade consistently using Horizontal Support and Resistance Level combining a technical chart pattern with candlestick patterns.
Focus on the HIGHS and LOWS. Higher Highs and Higher Lows. Lower Highs and Lower Lows.
And focus on the Daily Close. Focus on the BREAK and RETEST of Support and Resistance on a Daily Close basis.
For confluence use diagonal support and resistance (Trend Lines), Exponential Moving Averages - Dynamic Support Resistance (EMA 10 EMA 20), and Fibonacci Retracement.
For Targets use Measured Objective, Measured Moves, and Fibonacci Extensions.
Trade the Monthly Chart, Weekly Chart, Daily Chart, H4 Chart Time Frames. Emphasis on the Daily Chart. Combining Daily and Weekly Charts Analysis for Trades on the Daily Chart will improve Trading Performance.
"Forex Journal"

AUDJPY LONG After a bullish engulfing pattern AUDJPY LONG After a bullish engulfing pattern.
The bullish engulfing bar pattern tells us that the market is no longer
under control of sellers, and buyers will take control of the market.
When a bullish engulfing candle forms in the context of an uptrend, it
indicates a continuation signal.
When a bullish engulfing candle forms at the end of a downtrend, the
reversal is much more powerful as it represents a capitulation bottom.


IDA: Enter long after bullish engulfing candleBullish engulfing candle formed on 16Jul within the upwards channel. Low MFI indicates oversold and is moving higher (bullish). Look for an entry close to the bottom of the channel for a good risk:reward. Update your entry point and stops on a per day basis.

Patron de Velas Envolvente Bajista ignoradas por Bitcoin 2019Patron Envolventes Bajistas en el Semanal de BTC
2018
Dos velas bajistas de tipo envolvente fueron detectadas durante todo el año 2018 teniendos una continuación a la baja.
2019
Tres velas bajistas han sido detectadas durante este año, las dos primeras sin continuación y seguidas de fuertes subidas, la vela de ayer Domingo 14/07/2019 cerro en engulfing. Debemos estar atentos para saber si el BTC encontro soporte.

If wedge breaks up on current 4hr candle target= 11.9kI was anticipating we would break out of the wedge slightly lower here bu considering the previous 4hr candle closed as a bullish engulfing candle we could close the current one above the wedge and maybe even break here...if no I anticipate the 9924 horizontal will be the zone we break up from. I still think its quite likely we will be retesting the 1 day 50ma again before the larger 1 day and weekly consolidation is through.


LIC Housing Fin - Showing WeaknessIt has been observed that the price action firstly formed a bearish engulfing candlestick pattern at the resistance zone indicating weakness in price action. This is also supported by bearish divergence in RSI, indicating further price action weakness. Therefore, from current levels price action may further dip down to the next support zone which can be seen at the previous gap up movement. Now expecting the price action to reach next support zone at 500 levels with SL 555
Target- 500
SL - 558

US 30 Rollover: Engulfing Bear CandleHappy 5th of July! Ominous portent in the candlesticks. Get confirmation on the close and Monday's price action- imminent throwover from ATH IMO.
Trade at your own risk; GLTA!

gbp/jpy short setup on 4h chartgbp/jpy breaks the range area and now pullback to the resistance. I think its good to enter a short trade right now.also on 4h tf we can see nice engulfing candlestick pattern.

USD/CHF Controlled by Sellers and Below Annual OpenA confluence of Fresh Supply and Fibonacci 61.8% in USD/CHF.
Two weeks ago, seen in the W1 chart, the USD/CHF weekly candle had ended as a bearish engulfing pattern. The big red candlestick shows this bearish engulfment.
This pattern was a continuation outside bar candlestick pattern. It shows how the big red candle engulfed the one before and it also shows how significant the strength and determination of the bears were with the USD/CHF price.
Referring to the 1W or 1M charts, technically, the USD/CHF is bearish. and if we would like to sit with the dominant side, then we should look for a sell position.
In the 4H chart, we can see a very reliable setup for a sell position. A confluence of fresh supply and Fibonacci 61.8% of the recent downtrend.
In addition, on the 1W chart, we have a bearish outside bar pattern, that pattern with the confluence of fresh supply and Fibonacci 61.8% gives us enough signals to look for a sell position.

More downside if Btc closes 1 day candle as bearish engulfing.30 minutes or so left in the 1 day candle and we can see it still looks very likely we will close as a bearish engulfing candle. If this occurs it is highly probable that we will see considerably steeper downside to price action. Currently, we have already had a bit of a rebound after correcting 26% but odds are good this will be a dead cat bounce and the full correction will be closer to 31-41%. Let's also remember there are gap ups that need filled on the cmes future chart some even as low as 8500 or so. So I believing before this correction is through we will see a test of the 1 day 50ma. Last thing to mention is the weekly candle(not shown here) may very likely close as a big reversal hammer or possibly even close red. Currently the weekly candle shows that we had a clear blow off top. I expect bull momentum to resume shortly after the correction hits more than 41 percent and I expect it to do so with a level of insane volume that we haven't yet seen his entire bull run. Strap in and enjoy the ride wise to buy any and all dips after we cross the 31 percent correction threshhold imo. Of course as always though this is no financial advice.

EURAUD - 100pip Short?EURAUD has been moving in an interesting manner of late.
If you noticed on the 4 hour, a consolidation around 1.63500 to 1.6300 - with a spike up to 1.6450 and falling back into the 1.6300 - 1.6350 range thus creating a head and shoulders.
Daily - We have come into Yearly highs, with a Spike up and a bearish close on the day, forming a shooting star/bearish engulfing, with the next day retracing, however we saw another spike into the highs. Market has failed to break past 1.6350 resistance and another shoting star formed. We ar looking for a break below 1.6300 to confirm the head and shouders formation.

Nice pullback, bears signalledSelling at market price @ 0.69121 with
# TP lower down around support @ 0.68368 and
# SL just above the bearish engulfing pattern @ 0.69412
To learn the dynamics behind the analysis, please join my mailing list using the link below zc.vg
As usual don't bet the farm. Good risk management won't kill you but the lack thereof could!

EURUSD Bullish Continuation - Long Trade - waiting to enterHello all
Following the USD strength heading into last Friday and the pull back - I am expecting USD to potentially stay strong for the next day or two until the FOMC on Wednesday and the USD to weaken considerably. (after some stop hunting.)
I am looking to go long at this level - which is a 61.8% retrace of the current leg higher.
EURUSD is cycling higher nicely
Sadly I moved my stops too high on the related trade below and it took me out before heading higher. - Always important to trade multiple pairs and types and I was long on Gold through last week which made up for it.
I am expecting this to go higher for another leg - however it could be a messy start whilst it happens.
I have put my stop loss below the 78.6% retrace area - however potentially this could drop all the way to the lows and create a double bottom before heading higher again.
I am waiting for price action in this area - bullish engulfing candles on this occasion and once I get one, I will be in.
Thanks for looking at my trade idea.
DuncanForex.com is live with the opportunity for you to subscribe to site news and be eligible for discounts on training courses.
you can also see my capital growth over April and May too. Risking just 1% per trade.
The site will be fully live in less than 2 weeks.

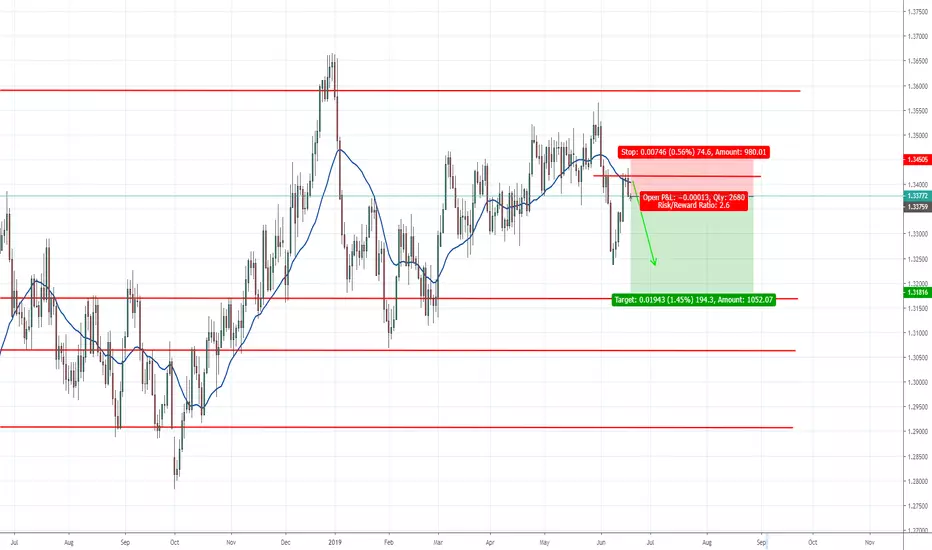
Change in market structure# Price has failed to continue making higher highs
# After the last bearish move price has pulled back to and pinned the 1.34505 level
# Bearish engulfing completed on D1 time frame
# Moving average providing resistance as price struggles to break through
Selling at market price 1.33759 with
# SL above the bearish engulfing high @ 1.34505 and
#TP lower down around support @ 1.31816
To learn the dynamics behind the analysis, please join my mailing list using the link below zc.vg
As usual don't bet the farm. Good risk management won't kill you but the lack thereof could!