Bullish Opportunity on USDCNHHello traders!
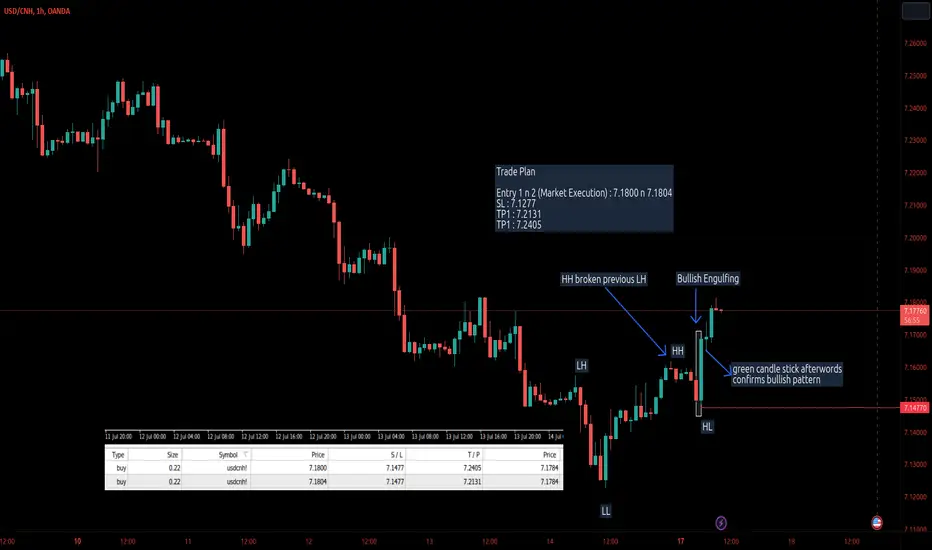
I would like to present an exciting trading opportunity on the USDCNH currency pair, which appears to be trading bullish on the 1-hour chart. After analyzing the price action, I have identified a compelling bullish engulfing candlestick pattern, suggesting a continuation of the upward trend. Let's dive into the details of this trade plan.
Trade Plan:
Entry 1 (Market Execution): 7.1800
Entry 2 (Market Execution): 7.1804
Stop Loss (SL): 7.1277
Take Profit 1 (TP1): 7.2131
Take Profit 2 (TP2): 7.2405
Reasoning:
Bullish Engulfing Candlestick Pattern: The recent candlestick formation indicates a shift in market sentiment, as the bullish engulfing pattern has formed on the chart. This pattern typically suggests a reversal of the bearish trend and the emergence of bullish momentum.
Strong Buying Interest: The presence of a bullish engulfing candlestick pattern signals increased buying pressure, as the buyers have overwhelmed the sellers during the given timeframe. This suggests a potential upward movement in the USDCNH pair.
Trade Execution:
To take advantage of this bullish opportunity, I have executed a market order with two entry points. The first entry is at 7.1800, while the second entry is at 7.1804. This allows for a staggered entry strategy, potentially capturing a better average price and managing risk.
Risk Management:
To protect our capital in case the market moves against us, I have set a stop loss (SL) level at 7.1277. This level represents the maximum acceptable loss for this trade setup. It's crucial to adhere to proper risk management principles to safeguard our trading capital.
Profit Targets:
For potential profit-taking, I have set two take profit levels. The first take profit (TP1) is at 7.2131, representing a moderate level of resistance on the chart. The second take profit (TP2) is set at 7.2405, targeting a stronger resistance level. Traders may consider adjusting their positions or locking in profits at these levels.
Please note that trading involves risk, and it is essential to perform your own analysis and risk assessment before making any trading decisions. This post is intended for educational purposes only and should not be considered as financial advice.
Happy trading and may the markets be in your favor!
Disclaimer: The information provided here is based on my analysis as a technical analyst and may not be accurate or suitable for everyone. Trading involves substantial risk, and you should only trade with capital you can afford to lose.
Engulfing Candle
Bitcoin in MAJOR Trouble?Recently I posted an idea about bitcoin breaking out and running to much higher prices and shortly after, the number 1 cryptocurrency asset attempted to take the first step to doing so. However, there was no follow-through in price action and now Bitcoin finds itself in a very vulnerable position. It is still very bullish in my opinion and I do believe more price action to the upside is coming, but right now Bitcoin has painted several bearish signals on its chart that must be discussed.
One of them being a bearish reversal candle on the daily chart. More specifically referred to as a bearish engulfing candle. They form at areas of resistance and are often validation of weakness in price action such as bearish divergences for one example. There are other bearish reversal candles as well.. this is just one of them.
We also have major weakness in relative strength as we have now confirmed triple bearish divergence on the daily RSI. There is also a strong case for bearish divergence on the weekly timeframe as well. For now it is expected for us to remain in the trend but with all of this major weakness in the market, follow through sell pressure could come at any moment. We are now heading into the weekend, so the price action over the next few days will be unreliable. This could be a good thing as this may give unsure traders time to adjust or hedge their positions.
If and when that breakdown occurs, there are levels of interest that we will discuss. But for now as we head into the weekend, we must simply wait until institutional markets open back up on Sunday evening.

Nifty could be very close to the end of the current rally.Points to note:
1. Bearish RSI divergence on the NIFTY daily chart.
2. Bearish engulfing formed.
3. Above average bearish volume.
Consolidation or reversal possible. Avoid fresh longs.
❤ & follow for more.

How to Spot and Trade the ENGULFING CANDLE
Hey traders,
In this post, we will discuss a classic candlestick pattern formation each trader must know - the engulfing candle.
Key properties of this pattern:
🔑 Engulfing candle is a reversal pattern.
🔑 Engulfing candle can be bullish or bearish.
❗️Also, remember that this candle demonstrates the highest accuracy when it is formed on a key level (support or resistance).
⬆️Bullish Engulfing Candle usually forms after a strong bearish impulse.
Weakening, the market keeps going lower forming bearish candles.
However, at some moment, instead of forming a new bearish candle the market reverses. The price forms a bullish candle that engulfs the range of the previous bearish candle and closes above its opening price.
Such a candle we call a bullish engulfing candle.
The main feature of this pattern is the fact that its total range (distance from the wick high to wick low) & body range (distance from body open to body close) exceed the ranges of a previous bearish candle.
Being formed on a key support level or within a demand zone it signifies a highly probable pullback or even a trend reversal.
⬇️Bearish Engulfing Candle usually forms after a strong bullish move.
Reaching an overbought condition, the market keeps going higher forming bullish candles.
However, at some moment, instead of forming a new bullish candle the market goes in the opposite direction. The price forms a bearish candle that engulfs the range of the previous bullish candle and closes below its opening price.
Such a candle we call a bearish engulfing candle.
The main feature of this pattern is the fact that its total range (distance from the wick high to wick low) & body range (distance from body open to body close) exceed the ranges of a previous bullish candle.
Being formed on a key resistance level or within a supply zone it signifies a highly probable pullback or even a trend reversal.
Take a look how powerful the engulfing candle is: on Gold chart, 4H time frame, the price formed a bullish engulfing candle after a pullback. The formation of the pattern immediately triggered a bullish continuation.
At some moment, the market became overbought, the formation of a bearish engulfing candle confirmed the initiation of a bearish movement and the market dropped heavily then.
📝Engulfing candle can be applied for scalping lower time frames, for intraday trading, or even for swing trading.
Personally, I apply this candle on daily/4h time frames as one of the confirmations of the strength of the structure level that I spotted.
Let me know, traders, what do you want to learn in the next educational post?

Mastering Engulfing Candle Trading
📚Engulfing candles are an essential feature of technical analysis in forex trading. An engulfing pattern happens when a larger candle engulfs the entire body of the previous candle, signaling a potential reversal of the current trend. Engulfing candles, which can be either bullish or bearish, are trusted by many traders for their reliability in predicting future price movements. However, to become an expert in engulfing candle trading, one needs to learn how to identify the best ones and leverage their body size effectively. In this article, we will look at the crucial steps to master this trading strategy.
🔎Identifying the Best Engulfing Candles
One of the key aspects of trading using engulfing candles is knowing how to spot the strongest signals. The best engulfing candles should be resistant to the noise and inconsistent movements that can often occur in the forex market. The first step towards identifying the best engulfing candles is to focus on the size of the preceding candles. Candles with small bodies and long wicks produce too much noise and can lead to false signals. Instead, seek engulfing candles that develop after a significant price move, ideally with a larger body and shorter wick. Higher timeframe charts - like the 4-hour and daily - offer better accuracy in identifying reliable engulfing patterns.
💪Leveraging Body Size for More Efficient Trading
The size of an engulfing candle’s body plays a crucial role in determining the strength of a trend. A larger body indicates more significant price movement and more active participation from traders. The size of the engulfing candle can also help ascertain the potential strength of the new trend. Bigger body sizes usually signal a stronger trend, whereas smaller bodies usually represent a more moderate price move. Traders can leverage body size to adjust their trading strategy – for instance, employing wider stop losses for more significant movements or using tighter take profit targets for moderate trends.
I have collected couple of good engulfing candles that we were trading with our team.
Take a closer look at their body sizes and the previous candles.
Such candles alone can provide fantastics trading opportunities.
🔔Conclusion
Engulfing candles are an essential tool in forex trading, and their size can significantly help traders identify the best entry signals. Traders who master engulfing candle trading can develop a more accurate technical analysis strategy that yields high returns. By continually analyzing candlestick patterns and using other technical analysis tools, traders can build robust investment strategies that enable them to become profitable forex traders.
What do you want to learn in the next post?

CADJPY BEARISH THU 6 Jul 2023 (education)The price is ranging structure in monthly and daily timeframes
the price hits the upper range and reject with engulfing candles at the supply zone in daily timeframes
The set up is simple.
Engulfing breakout of range at the supply zone after price been ranging for a while.
The risk reward ratio is 5
the stoploss level is above supply zone
the target is the double bottom that cause price go went up
I risk 0.10% of entire portfolio on this trade.

Gold 1D Analysis , Bears comingHello friends.
I saw a three top pattern in 1D chart and a bearish divergence included too.
after the 3rd time price touch 2050 Resistance level , we can see in picture below ,
Buyers couldnt lead price upper and Sellers came in strongly.
So , as you can see in Zoomed Chart , we have a Bearish Engulfing pattern there and
in the main chart , we see a decrease in RSI tops but 3 tops placed in a line.
this means the Trend will weak and the price will Drop.
I think our Swing targets are 1958 (Former Bottom)
and 1933(EMA 50).
Thank you for reading my IDEA.
PLZ share me your opinion.
Have good trades.
<<< LEARN first , then Omit L & EARN >>>

USDJPY high around 143.800The dollar has been in a weak uptrend for the past few hours so I decided to take advantage of some indecision at a high. Price presented a shooting star on the 30minute chart as well as a strong bearish engulfing on the 5min at the exact area needed for a short. This area is exactly where price closed at then was immediately rejected on last Friday (6/23). This retest could be early considering NY session is hours away. Also the lower timeframes haven't began creating lower low yet.

usdjpy is throwing bearish reversal signalsThe dollar has been very strong versus the Yen lately. Price has reached yet another high and i believe its like to retrace bearish. The sellers have stepped in a provided some indecision and buy exhaustion. The blue 8 exponential moving average crossed to the dowside below the 21 simple moving average and price began a minor downtrend. This usually occurs before a breakout and upon a retest of that bearish candle that initiated the downward movement.
I'm awaiting a re-test of $13.868- $144.155 so signal if price would like to continue bullish intraday or retrace bearish and sell for lower lows now.

GRSE-LONG DAILY TIME FRAME NSE:GRSE
Stock is in continue uptrend from last few days it has never traded below its previous swing in past few days.
On 27th-June stock has shown Bullish Engulfing (Bullish price action) which is good sign for positional equity/swing traders.
We can go long if it opens flat on Tuesdays (28th June) trading session.
SL: 550 Target: According to your risk reward 1:1 or 1:2
This is only for educational purpose, please manage your risk accordingly.

🚀USDCAD double bottom: bulls ready to charge📈Brace yourself for a game-changing setup on the USDCAD forex pair! 🌟
The charts are showing a compelling buy signal in the 4-hour timeframe, with price bouncing off a solid support level at 1.31400.
But that's not all! The candlestick pattern has revealed a powerful bullish engulfing formation, signaling a potential trend reversal in the making.
Get ready to set your sights on multiple take profit levels: first target at 1.31950, representing the 0.618 Fibonacci retracement. Then, the neckline at 1.32200 beckons as our second milestone, followed by the third take profit around 1.32500, and ultimately, the grand target at 1.32800!
Adding fuel to the fire, the MACD indicator is on the verge of forming a bullish crossover, adding further confirmation to this exciting setup.
Don't miss out on this potentially explosive trade opportunity! 🚀
Respect money management
don't forget to press the like button if you think this insight was helpful🚀

USDJPY retracement at the highAfter a few indecision candles at the high, followed buy a volume push up to a major resistance, I became alert that a bearish setup might present. Friday closed off with a variation of a bearish engulfing. When price closes beyond a price then closes right back beneath it its a sign that this price is being rejected. Naked analysis tells us that the 1hour chat has already began its downward momentum. A minor double top formed. My short entry was based on the high volume bearish engulfing re-test at the neckline. The 30MIN chart has begun creating its lower highs and lower lows. This is a short scalp. the buy will likely present later in the week.

Tellurian: Weekly Bullish Engulfing Falling Wedge BreakoutTELL is currently breaking out of a Falling Wedge after confirming a Double Divergence in the MACD at the 0.886 and also Bullishly Diverging the previous week's candle. A break of the $1.55 level could quickly take it back to $6.5, as that will likely also align with the RSI entering back into the Bullish Control Zone.

USDJPY to create another higher highUJ is still in its major uptrend as price continues to create strong higher highs and indecision lower lows. I took a buy based on the 30min structure. My target is the next daily resistance level. I believe that buying at a higher low off of a retest is a valid opportunity. Especially after a volume bullish engulfing candle.

EURUSD to make its 4H higher highI believe the daily momentum for this pair is still bullish. The 4H retraced to the 38.2% fib and presented a Volume bullish engulfing on top of a trendline . While I do believe the Euro is getting weaker, one more higher high or bullish push would make perfect sense considering the fact that its beneath a major resistance and had been rejected there prior. Its approaching an untested breakout zone while these daily candles aren't very strong.

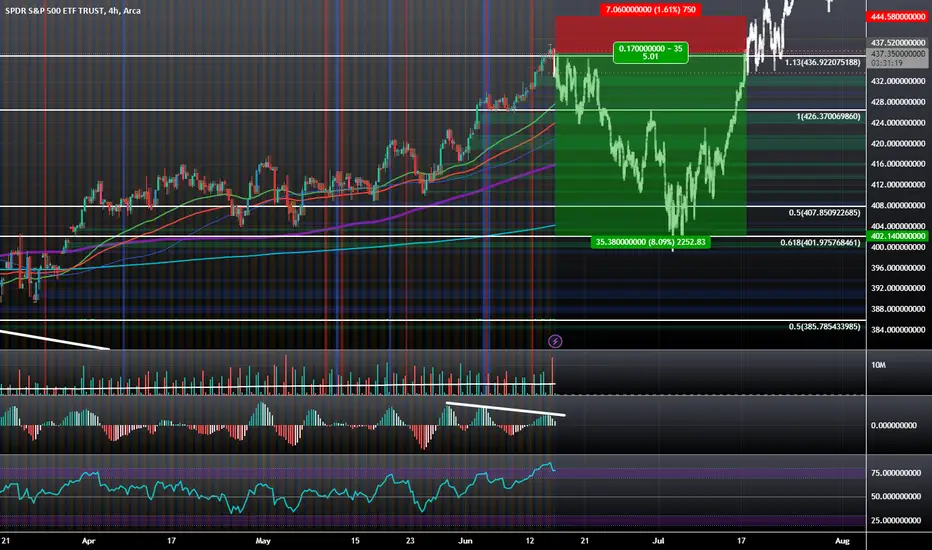
$SPY: 50%-61.8% Retrace Seems Likely Before Continuation HigherThe SPY seems likely to pull back to the levels of $420 to $400 before it can later decide whether it wants to continue the overall Bullish Trend to all-time highs. In the meantime, we are dealing with Double Bearish Divergence on the MACD, Overbought Conditions on the RSI, and a Bearish Engulfing Candle on the 4 Hour all while trading at the 1.13 Retrace of the local range it just broke out of.
USDCHF sellUsdChf has broken its spport which now has become Resistance and it has tested it also made a nice downwards move the confluance to enter this trade is Rally base Rally and brake and wick rejection on both side and high bear volume so we will be having this trade

USDJPY rejected at 4H Lower HighI decided to short UJ here as the 4H shooting star at a re-tested area was a bearish enough signal for me to go short. Price has been making Lower Highs on 4H and daily chart. The bullish candles have been forming with a lot of indecision. This entry was taken based on the 4H close, as well as the 1H presenting a strong evening star at a Evening star re-test. My entry was upon a bearish 15min engulfing at a potential high/re-test of resistance. My stop loss is just Above the high of the shooting star. My target is the next daily Lower Low.

EURAUD 4Hrs Trend channel +190 PIPTimeframe: 4 Hours
Long Day Trading Position
Initial Take Profit : 1.6183 to the channel middle point
2nd TP: 1.6238 (to the high volume node of the volume profile)
SL: 1.593 (breaking the trend channel)
The pair is in a bearish tunnel for more than a month, and now in the trend channel's bottom, and has a high potential to go up again during the next few days↑.
↝✔
Esteem your Analysis and seek improvements ⌁
@AbdullahTech ♾✽
June23 ↝✔ Keep an eye on the next price journey ;)

EUR/USD Short - NY Open June 7thSetup to go short on EURUSD on NY Open, sweep of the asian range liquidity, retesting the HTF supply and rejecting with a bearish engulfing candle. Targeting the nice imbalance below for a 3.5 risk-reward ratio. FX retail sentiment is all long. Good luck traders!

Bearish engulfing candle 1WKeeping it simple. There is a bearish engulfing candle on the 1W with a clear invalidation level of 30650
This is a major resistance level including the Microstrategy average purchase and Elon Musk - Tesla 2021 sell price. It is also the yearly low of 2021. This is financial advice.

TAP - start of bullish trend?TAP bottomed in Sept 2020 and began to move higher till 7 Jun2021, after which it made no further progress and pretty much churned sideways in a wide range for the next 11 months.
Finally, on 2nd May this year, it began to propel strongly above the neckline due to positive earnings surprise. However, it then began to pullback over the following few weeks, all the way close to the neckline before staging a strong rebound. This is a classic breakup and retest that affirms that the neckline (formerly a strong resistence) is now the new "support".
The stock appears to be poised to began an uptrend that could last a while. The next strong resistence could be around $75. However, it is just a level to look out for and nothing is cast in stone. Trade management (which varies according to one's trading style and temperament) is required to see how far one is able to ride a trend.
Disclaimer: Just my 2 cents and not a trade advice. Kindly do your own due diligence and trade according to your own risk tolerance and don't forget that money management is important! Take care and Good Luck!

Gold prepared for another bearish tumbleGold has retraced to the neckline of the double top pattern, upon which it provided a strong bearish engulfing. The weekly resistance has failed to be completely broken in addition to a rejection of the 38% fib. The 4H is trading within a range creating a new lower low along with ADX. The moving average is crossing to the downside as well as a trendline break to the downside. Price is now on the short side of the trendline. I will look for shorts near the weekly resistance for a 4H lower high. or a complete retest of the major 38% where the daily was rejected. Targets for shorts are -27%. extended target at -61%.
