Q's (QQQ) Look Right for a...POP!Q's (QQQ) Look Right for a...POP!
I spy a falling wedge and a higher low on the RSI indicator!!! Q's look ripe for a pop! It'll be nice if we open above 275.7 on Monday (Oct. 24, 2022).
Also, the 5MA crossed up the 10MA on the daily and is approaching the 20MA.
Therefore, my bias on QQQ is bullish.
Peace, Love & Abundance,
MrALtrades00
Engulfing Candle

CHFJPY to fallOn weekly timeframe, CHFJPY has reached an overbought zone (RSI), an intersection between upper channel and horizontal support.
On lower timeframe, we've seen a big rejection recently, and then a correction upward : here we reach the 80~88% fib levels of the last rejection (D1), with a bearish engulfing pattern yesterday. This behavior can be a potential sell signal.
If we follow correlation to compare currencies, we find more confirmation : USDJPY has reached very high levels too fast, becoming overextended, and JPY will probably start a correction soon, meanwhile USDCHF is retesting a daily resistance for the fourth time, giving bullish signals, not yet an overextended move.
Goodluck,
Joe.

Bullish Engulfing on ExxaroA bullish engulfing candle pattern has formed on JSE:EXX . This is a bottom reversal signal, so we could see a move up to around the R22 level.


The SPY Looks Like It Could Soon See $420-$425Rigtt now the SPX is trading inside a Descending Boradening wedge at a Previous Zone of Weekly Congestion and has Bullishly Engulfed the Weekly lows and held above said lows.
So long as we can continue to hold these levels we should eventually see the top of the channel and previous Support/ Resistance level of $420-$425 and (if we are to aim for Full Measured Moves we'd expect to see $478.50 but for now lets just target $420-$425 then move forward from there); However any serious price action below this Congestion Zone would likely result in us fastly approaching the $200s, so to be safe i will Cut this Bullish Trade loose if we Break and Close Below the 200 Week Simple Moving Average.

QQQ: A bullish reaction in a support! What's next?• QQQ is doing a Bullish Engulfing today, a reversal candlestick pattern;
• This pattern appeared just above the support at $275 (June 30 low);
• If QQQ loses this support, it’ll just resume the bear trend, and the next support is the $268;
• However, if it confirms this Bullish Engulfing it’ll trigger a technical reversal, which might take it to the $290;
• The $290 is a previous support (Sep 6), and it is supposed to work as a resistance in the future, according to the Principle of Polarity;
• In addition, the $290 is where the 21 ema is right now. Yes, the 21 ema is a dynamic indicator and it’ll probably drop more in the next few days, but it is still very close to this area;
• If it’ll trigger a mid-term reversal in the future, only time will tell. For now, lets focus on this support level.
Remember to follow me for more analysis like this! Keep in touch.

-FVG Example This candle creates the -FVG high. Use the low of this candle and extend out.
This candle breaks market structure to the downside in the form of an impulse candle, bearish engulfing.
The high of the candle following the engulfing candle sets the low of the -FVG and the candle should not trade back above through the candle high that created the lo.
You can look for setups at the -FVG high @3716.70, middle @3713.70 and low @3710.70.

Monthly Inverted Head & Shoulders: MACD/RSI Bullish Divergence.We have an Inverse Head and Shoulders Visible on the Monthly timeframe with triple MACD and RSI Bullish Divergence and a Monthly Bullish Engulfing. I will position now and take profit at the neckline and then again at the previous ATH.

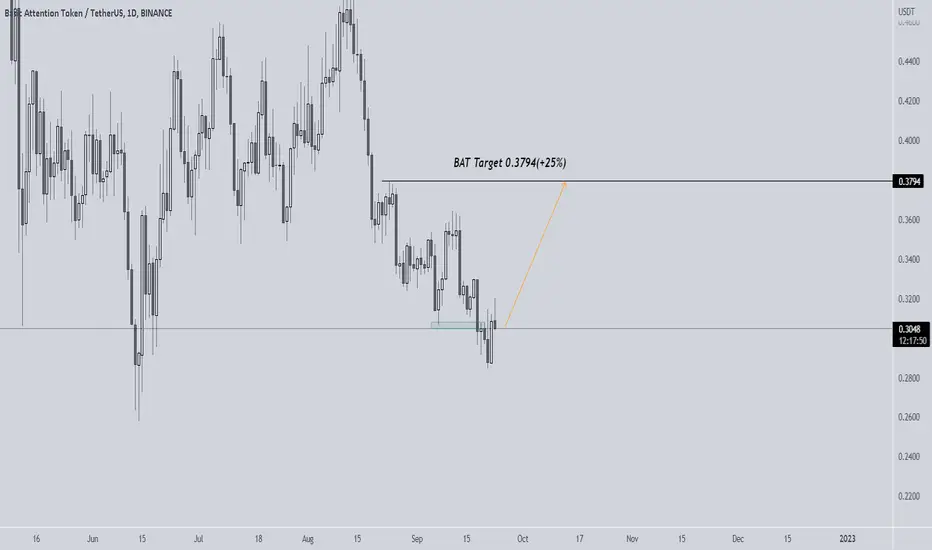
BATUSDT: #Big bull coin(1)Hello traders!
Welcome back to another episode with analyst Aadil1000x.
Previously we made big fat mistake in Selling Algo as big bulls are ready to jump in and majority of the coins will fly or they will move at least 25%.
BAT is one of the pairs which will move more than 25% within few days. The target of BAT is 0.3794 which will give +25% of the investment.
We also buy few more coin in this bullish season.
BTCUSDT pullback to triangle trendlineThere's no reason for bullish bias. The price action shows an engulfing bearish after a pullback to triangle upper trendline, healthy 30% retrace and retest. Supports broken. Price below daily volume point of control -rejected from POC. Expecting lower lows aiming 14.6% as seen on chart. 17K is possible in a next swing downward. Plus hidden bearish sign from Chaikin Oscillator. Fibonacci retracement applied w/ 88.6% and 14.6% key levels. Bearish 2-D swing to complete the major Head and Shoulders correction @ all retracement expected.

EURCAD Target Price 1.35148EURCAD Currency Market. Engulfing Candlestick formed on the Daily Time Frame.

Never ever have been before and here we go againTSTW.
Not legal and financial advice;
Any information provided here is only the personal opinion of the author.

Buying Dusk from BottomHello traders!
Welcome back to another episode with Analyst Aadil1000x.
Dusk has formed a very strong Bullish pattern and the Bulls are looking to jump in. So we are buying at the bottom.
This bullish pattern will give a boost of at least +12%.
Stoploss 0.11619(-3.6%)
Target 1, 0.12799(+6%)
Target 0.13505(+12.1%)
Suggested leverage 7x - 20x.

NQ1! upd. Sep., 2022 TWTS.
Not legal and financial advice;
Any information provided here is only the personal opinion of the author.


ETH... short and long positionhello guys
eth had formed a QM pattern at daily time frame and in upper time frame (weekly) showed as an engulfing candle so it so perfect for short position, on the other hand, this QM pattern is on flip area and flag on it, but if price break up this area (fl at flip) that i showed as a gray zone, make this crypto currency so bullish and i will update this analysis for long position.
always do your own research.
If you have any questions, you can write it in comments below, and I will answer them.
And please don't forget to support this idea with your like and comment.

US Dollar Reversal Signals Brew, But Will the Key Uptrend Hold?The DXY Dollar Index confirmed a breakout under a near-term rising trendline from August as prices confirmed a Bearish Engulfing candlestick pattern.
This might open the door to some weakness in the near-term. But, will the dominant uptrend hold?
Keep a close eye on the 50- and 100-day Simple Moving Averages (SMAs). These could reinstate the dominant upside focus.
Resuming the uptrend entails clearing the 78.6% Fibonacci extension at 110.9316. That exposes the 100% level at 112.643.
TVC:DXY

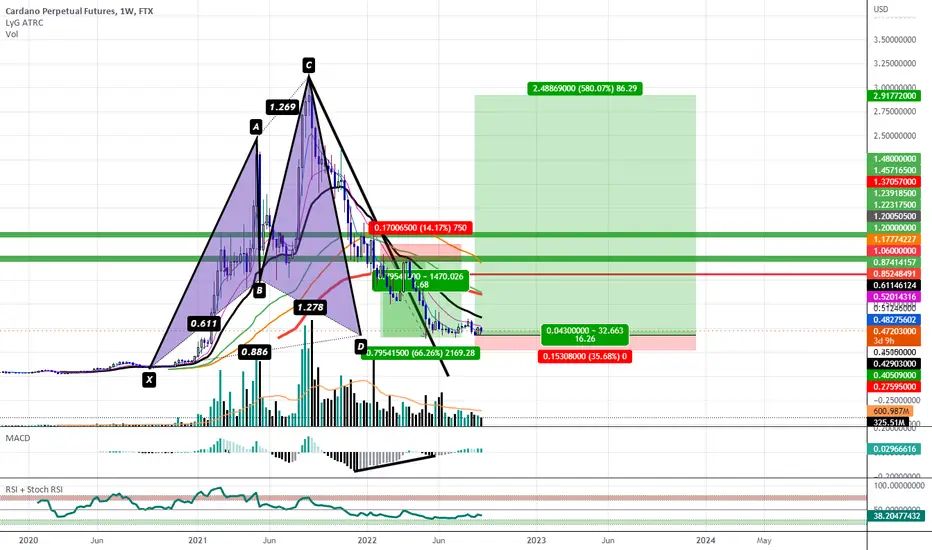
Cardano: Bullish Cypher at an 88.6% RetraceWe have Bullish Divergence on the Weekly MACD and a Bullish Engulfing of the Previous Week at the 88.6% Retracement. I would like to call this a Shark but we are missing the 1.618 Extension however due to some of the other Bullish Variables i think that i would instead see this as a Bullish Cypher that went a little too deep to the 88.6% rather than the 78.6% retracement as we sttill have the 1.272 Confluence here.
Bollinger Bands Strategy For The DAX40 Today, I am going to speak about my new DAX 40 Bollinger Bands Strategy.
I have been testing out a new strategy using the Bollinger bands, fib retracements, and fib extensions on the 4-hour chart for the DAX. I am currently forward testing this strategy and I plan to keep forward testing it until the end of the year so we can see how it fairs in the long run and if it's going to be profitable or not. I would like to share this idea with you all today.
Let me explain the setup.
We open up the 4-hour chart on the DAX and we open up the standard Bollinger bands.
We then look for entries as soon as we see price break through the top or the bottom of the Bollinger bands. This is somewhat of a reversal strategy. I wait for the price to break either side of the bands, and then I look for the next candle to be the opposite of the candle that broke through or wicked through the bands. If the next candle engulfs the previous candle, I then use the fib retracements to find an entry. I run the fib retracements over the engulfing candle and enter on the 0.236 fib level. My stop will always be a few pips below or above the 1 fib level.
I then take my trend-based fib extension tool and place the three clicks like so :
First click – on the top or bottom of the Engulfing candle.
Second click – The other side of the engulfing candle.
Last click – simply drag the took towards the right and extend it out. I use these two fib levels for my targets.
Generally, I like to see price touch the other side of the bands as my target and if the extension lines up with that, then great. I always look for a minimum risk to reward of 1 to 1.5 or 1 to 2 ( Depending on how far the extension takes us )
As you can see in the video below, so far in the month of July, this strategy generated close to 10% in profits ( risking 1% per trade)
In August this strategy generated 3.5%
So, so far we are doing well with it. I have done back testing with it but I prefer forward testing on a live account as this usually helps confirm the psychology for me entering and exiting this setup.
So, I will keep posting videos whenever A Dax setup presents itself. Let's keep this testing going until the end of the year and then we can decide if we should try it on a funded challenge!
The Vortex Trader

DAX SHORT Massive Engulfing Bearish CandleNew York market closed today but the German market is possibly in crash mode.
Macroeconomic issues are weighing heavily as are energy commodity costs.
Will this impact the US markets ? Please offer your opinion


Pip Goal: 49.1 Pips (GBPJPY)Engulfing Bar candlestick pattern formed on GBPJPY. Pound Yen Currency Market is Bearish.

BTC 4H chart update.Simple and price action!
chart is so obvious that does not need anymore comments.just be careful when adjusting stoploss!
good luck all!
