ENJ

ENJ Price will regain it's position!Hello and welcome traders to another trade idea with CRYPTO_BAHADOR!
ENJ Uptrend will soon take over.
Small time frame support will act like wedge.
Buy Zone: 1400 - 1520
Sell at: 1750 - 1900 - 2050
SL: 5%

Watching the wedgeI have drawn a wedge on the chart. I don't see really clear direction on this chart. The daily chart might be indicating a bottom have to watch weekly.

ENJUSDT Daily Timeframe AnalysisI find price to be in Nested Wedge Patterns.
You can see two wedges on the chart. Bigger Wedge is more important as the Mid point of the Bigger Wedge and Intial Point of the Smaller Wedge are coinciding so they mark a important support level.
Price usually respect the mid-point of any wedge before any reversal or resumption.
Breaking below the Support will give us downtrend for months and breaking above the minor range at support is likely to give another test to top of the Wedge.
Plan you trades only if the price is breaking any of the levels mentioned above. Probability is what you should look for while trading alts.

ENJUSDT AnalysisThere are 3 SELL signals present at the moment. I'm BEARISH and I don't think this is a good time to buy now.
If you want to buy again, we have 3 options;
1- You can wait for EngineeringRobo's BUY signals to be present,
2- You can wait for candles to open-close above resistance level (0.17) for 1D to buy,
3- You can buy when candles touching the support line (0.10).
After you buy, please watch out for EngineeringRobo's sell signals and consider selling it.

Enjin trading idea Hello, Traders.
ENJIN is testing a major support level. It Would be a great opportunity to open a long position if it form a reversal candlestick pattern on that level.
Best regards.

Engin Crypto Gaming Platform is So huge!!! It’s been a busy year for Enjin.
-->It officially launched the Enjin Platform, a blockchain PaaS (Platform as a Service) that allows developers to create and manage blockchain games without knowing any blockchain code.
-->It kicked off its Multiverse program. This gives game developers everything they need to incorporate their games into the Enjin platform, including marketing, community management, and crowdfunding.
-->And it released software development kits (SDKs) for Java and Godot. Both are popular programming languages and make it easier for developers to build on Enjin.
The hard work is paying off. Enjin started the year with roughly 50 million assets on its platform. Today, it’s over 1 billion
Next up is Efinity, Enjin’s game-channel network for highly scalable blockchain transactions. With Efinity, a game can perform nearly infinite volumes of transactions between millions of players and the game server. And these transactions will remain trustless and verified on the Ethereum blockchain. Efinity’s release is expected later in 2020.
With all these new developments and Enjin’s draw on millennials, we think the project has lots of room to run.


ENJUSDT analysisMoon, buy2 and green robo signal signal . Here is my analysis:
2. We can buy at support = 0.2usdt
3. We can buy when resistance turns to support (1D open & close above 0.22usdt) = 0.22usdt
We can use sell2, sell1 or hell signal for sell decisions. Otherwise, we can also sell at resistance depending when you buy.

ENJ USD (calculated from the beginning of coin release)To make it as simple as possible, after breaking first major resistance line we formed second one lately. so i guess if we close this week candle above second major resistance line, we can see positive price action. ENJ looking promissing! GL


ENJ CAN BLAST SOON #ENJ Trade Line Breakout Going On & #ENJ Have 50 EMA Strong Support So #Enj Can Blast Any Time

ENJ/BTC: Higher Lows, Looking for Further Momentum 2D (Aug. 13)X Force Global Analysis:
If you find our analyses to be helpful, make sure to support us by dropping a ‘like’
In this analysis, we look at Enjin Coin's (ENJ) 2 day chart, identifying key trend lines and areas of support.
Analysis
- ENJ has been creating higher lows and higher highs, until recently it has had a corrective trend
- Prices bounced on historical support, marked by the blue area
- It is currently trading below the 0.382 Fibonacci resistance, and has tested the 0.618 resistance with a wick
- However, as the overall trend is bullish, we could expect further bullish price movement from ENJ
What We Believe
Given that Bitcoin ranges sideways for a while, Bitcoin dominance will drop accordingly, providing opportunities for a bullish altcoin market. The overall cryptocurrency market is bullish, just as ENJ's overall trend.
Let us know what you think in the comment section below
Trade Safe.

ENJUSDT ANALYSİSI have 4 positive signals
If you hold this coin wait EngineeringRobo ' s sell signal or you can sell at the resistance line( $ 0,2132)
ıf you want to buy it wait for turning resistance line to support line then you can buy it around $ 0,21- 0,22 and watch carefully EngineeringRobo' s signals.
If you want to use EngineeringRobo please dm me.


enj long position SR flip enjin coinEnj to Btc going long with a SR flip in place. as long as bitcoin behaves.

Are we there yet?There is a chance that 100 daily MA is now acting as support. It could take a couple days to confirm a clear bounce. It is also possible to see a drop to 200 MA. Might be ideal to wait and confirm 100 MA.

ENJUSDT ANALYSISThe candles are stuck in between the support line (0.15313) and the resistance line(0.21398). In my analysis shows the candles go down now, so before you buy, you should wait at the support line.
when you buy in at the support line if you sell it at the resistance line. your profit will be about 40%.
I think it is a good profit, so good luck:)

The bottom inLooks like ENJBTC may have put in a bottom at the 200 Daily MA. RSI looks great. The lines on the chart are a possible down trend. The upper line being where i'd be most concerned to see a rejection. ENJ could still be in an uptrend though I try and watch for bear and bull case always.


ENJ BTCENJ BTC - bullish AF! lookin good. unless we break to downside from a large BTC move, but i bet it would fakeout and pop back into the bullish trend. lets go!
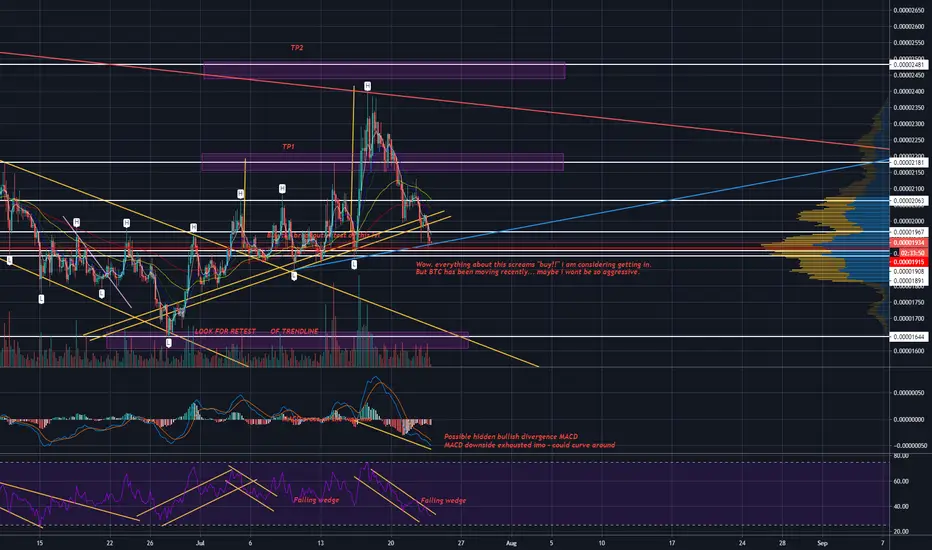

ENJ/USDT - Long - Potential 18%
Look after your portfolio and it will look after you & If you liked this idea, please like and subscribe to my profile
PAIR: ENJ/USDT
T/F: 1 HOUR
LENGTH: Medium
RISK - Medium
ENTRY: 17648
TP1: 17982
TP2: 18806
TP3: 19630
TP4: 20367
TP5: 20900
SL: 16597
NOTES:
- Be cautious with recent BTC uncertainty - follow with stop losses
- Uptrend
- Sat on Support Zone
- Huge Support Rejection Candles
- Oversold on RSI Deviance
KEY:
BONUS TP - It could continue to rise to a significant high although it is either very long term or a high rist target. REcommended to follow by securing profits with trailing stop loss.
LENGTH:
SHORT = 1-2 DAYS
MEDIUM = Less than 1 week
LONG = Less than 1 month
RISK:
LOW = E.G Stong support // Multiple bounces // Strong uptrend // Oversold // Breakout > Pullback > Support // Rejection Candles
MEDIUM = E.G Broken support // Trend Reversal // Consolidation
HIGH = E.G Not fully brokend Support // Overly mature uptrend
***Please note that all of my suggested Entries, TP's and SL's always ignore any precursor 0's***
Please always trade with caution, manage your trades and stop-losses This is not professional financial advice, just my thoughts and trades I am
