ENJ


ENJ price above ichimoku clound next station "Moon"ENJ price above ichimoku clound next station "Moon"

Is this retracement done.
This move seems possible based on previous moves. One thing that does seem a bit off is the short amount of time till recent bottom. Also possible to see a long price in the next 7 weeks assuming that each Eliot wave takes roughly 10 weeks. The last one taking 3 weeks seems does seem to short.
This image is a bit more clear on price levels with less clutter on the screen.


ENJ BTCENJ BTC - had news recently but still no movement. i think everyone is busy in the other alts that are popping

#Enjin $ENJAnticipating breakout soon through descending TL. This should hold above lower TL and then target upper TL post-breakout.
Stoch RSI looking for a reset here. Potential support on RSI trend as well.

ENJ/USD- Retesting Break - Potential Entry IdeaENJ broke briefly from trend and is now retesting original break price.
I'd like to see a candle close above resistance before taking a position here and will be running a reasonably tight SL.
Target will be 20% from break if confirmed.
Alternate entry at the lower end of the channel or lower support line.
As always not financial advice, just thoughts and TA.
Bingaz


When will support be found?Indicators seem to be showing the price continuing to go down a bit more. Looks like we might see something like march pull down below 21 weekly for couple weeks then another leg up.
21 weekly may act as support though the other indicators don't see to be showing such a small dip in price.

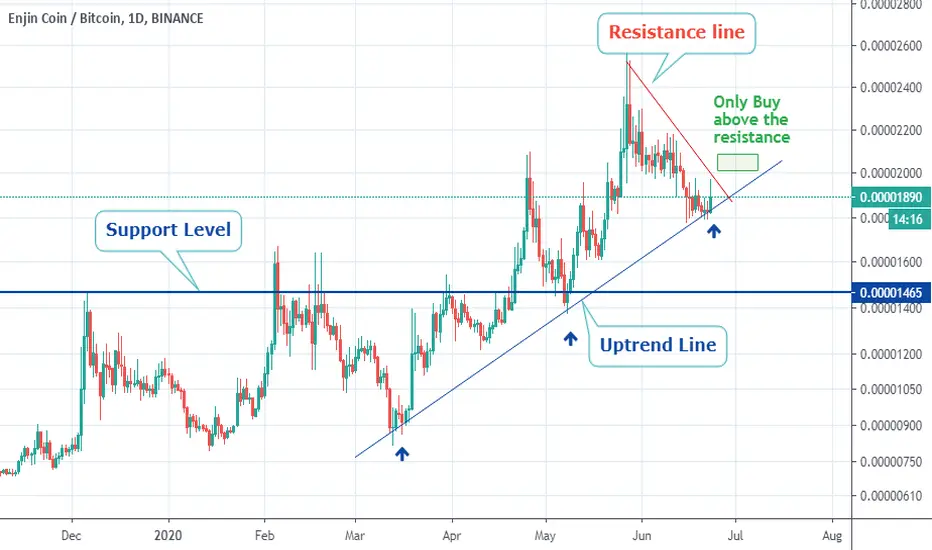
Bullish momentum on ENJ, but wait.Hello Traders,
The momentum still bullish with ENJIN after the support on this uptrend line test, but the price still below the short term resistance line so the moment is time for do nothing and watch the price test the support and resistance to see which direction the price gonna go so we can go with.
Push the like button and follow us.
ENJ is for long position for meENJin coin is now on 54 place in binance ranks. Before few days was on 53 place.
When 12 May broke bearish trend, who was consist from many pumps and corrections is now on the next correction from overbought market when it reached new ATH in USDT (binance). On BTC chart we see testing resistance line on 1D chart. When this test will be passed, we will see with BTC and the same with USDT chart, moving up.
When I analyse with Fib retracement correction from december, we can see many similarity. Strong support it was on price 0,069$, who we see on Fib. Now we have strong support from price 0,163$ to 0,17$, and FIB is on the same about 0,618.
This scenario when not be broken yellow support will be create move sideways with more confirm this support about price 0,167$ and next come moving to new ATH (on binance chart USDT).
When this yellow support will be broken, we going on lower yellow line, who is probably rising long term channel.


Reversion to meanLooking like price could fall to 21 weekly MA looking for support. The price has repeatedly been pushing on the top of the bollinger band. The candles seem to be showing an uptrend with both higher lows and higher highs. The other indicators are also showing price moving down. Just seems like this is a reversion to mean and that ENJ will out perform ETH by the end of the year.

ENJ Parabola Channel Ideas!Hidden Bullish Divergence on RSI & MACD for ENJ on Daily Chart of all three pairs (USDT, ETH & BTC).
Also, Look at the Parabole Channel on ENJBTC pair!

ENJ buy opportunityPlease feel free to comment or challenge me on my TA. Or leave a like to show support ---------------------------------------------------------------
- ENJ setting higher highs and higher lows
- Stoch RSI hit 0.99. Has performed well after this in the past
- Overal market sentiment is bullish
Entries:
- Bottom of the channel around 1800 sats
- Weekly support at 1701 sats
Targets:
- Daily resistance at 1986 sats
- Daily resistance at 2325 sats


ENJ Long... 5000 SATS SOONENJ on weekly Chart looks very Bullish to me..Hodling the horizantal support nicely.coming weeks i am targeting 5000 sats from ENJ


ENJ strongly bullishDon't miss this...
I won't add any comment on this.
---------------------------------
Good Luck

#ENJ/BTC (June 05)ENJ will dump sharply in next days. Its bull run was done!
Expected targets of the dump that you can buy and scalp some profit are : 1700 - 1200 - 800
Don't catch any price except these prices

ENJIN COIN (Enj Usdt) Short Term TargetIt has created 3 different trend lines since March. It has now touched the third trend line and is about to form a cup and handle. My first target is 0,23566. And if the fourth trendline occurs then second target is 0,3157.
In addition, the wedge formation that fell next to the trend line on the 2-hour chart has formed and is about to end.
This is not an investment advice. It is my own personal work. good luck to everyone.

ENJ / BTC Moving On A Parabolic CurveENJIN (ENJ) is moving on a parabolic curve which oftenly moves in parabolic price action and immediately sells off at the end of the curve. You can Google the term "parabolic curve" and see the symbolic chart which represents the typical price action.
Watch out the "buy the breakout" level and as soon as it breaks above, enter the trade and put your stop loss just below that level and let it ride.
Good luck!
