ENJBTC


Easy Loot | $ENJ/ETH Weekly TradeBINANCE:ENJETH | Estimated Time: 2 Weeks
Snipe Entry: 68202
Fomo Entry: 69802
Easy Loot Target: 75577
Target: 79970
Stop-Loss: 68104
Join Easy Loot
- Premium Signals
- Free Signals
- Active Community

ENJ bullish divergencePlease feel free to comment or challenge me on my TA. If you like my idea, please leave a like to show support.
--------------------------------------------------------------------
- Bullish divergence on the RSI (purple)
- Bearish divergence played out perfectly in the past (blue)
- Touching weekly support at 1701 sats
- Close to daily support at 1617 sats
- Touching the 100-day MA
- Forming a descending wedge

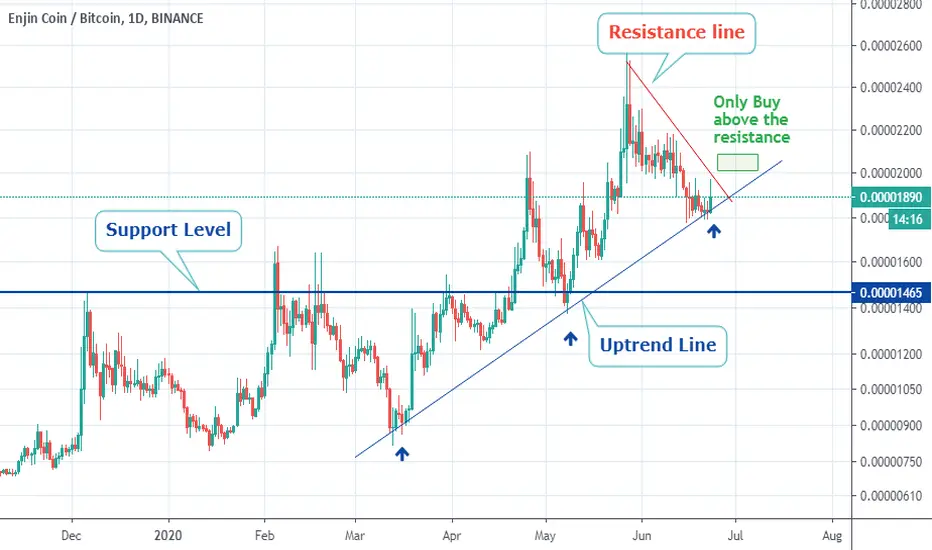
Bullish momentum on ENJ, but wait.Hello Traders,
The momentum still bullish with ENJIN after the support on this uptrend line test, but the price still below the short term resistance line so the moment is time for do nothing and watch the price test the support and resistance to see which direction the price gonna go so we can go with.
Push the like button and follow us.

Price divergence and indicatorAs you can see, there is an upward divergence in the price trend and MACD indicator. I want to enter into a deal with this strategy. We will see the result ...


ENJ Parabola Channel Ideas!Hidden Bullish Divergence on RSI & MACD for ENJ on Daily Chart of all three pairs (USDT, ETH & BTC).
Also, Look at the Parabole Channel on ENJBTC pair!

ENJ buy opportunityPlease feel free to comment or challenge me on my TA. Or leave a like to show support ---------------------------------------------------------------
- ENJ setting higher highs and higher lows
- Stoch RSI hit 0.99. Has performed well after this in the past
- Overal market sentiment is bullish
Entries:
- Bottom of the channel around 1800 sats
- Weekly support at 1701 sats
Targets:
- Daily resistance at 1986 sats
- Daily resistance at 2325 sats

ENJ Long... 5000 SATS SOONENJ on weekly Chart looks very Bullish to me..Hodling the horizantal support nicely.coming weeks i am targeting 5000 sats from ENJ

ENJ/BTC %50 GrowHello Everyone,
We find support @ 50 MA and we touched the resistance. We might have more than %50 grow chance to 0,000030.

#Enjin Coin BTCWe still expect another bullish wave in the medium term
Prices may drop on the white lines shown in the analysis
Please support the idea by pressing the like button
Profit so far on the channel
#DOCK +25%
#AMB +63%
#KAVA +66%
#ANKR +45%
#TROY +65%
#BQX +70%
#STX +37%
#OGN +21%
#POLY +70%
#TCT +70%
#CHR +32%

ENJBTC | Parabolic Curve | Trade Setup ENJ BTC
Points to consider:
- Respecting the very bullish parabolic formation
- Testing structural support
- RSI above 50
- Below average volume
- Price respecting and trading above 21 EMA
ENJBTC retracing to test structural support after an impulse move to the upside
Currently respecting the parabolic curve and trading 21 EMA both serving as very bullish indicators
RSI also above 50 and forming a symmetrical triangle, a break to the upside will support the bullish bias
Below average volume is an indication of an influx being imminent, this will also coincide with the possible breakout
Next target will be the .5 Fibonacci retracement in confluence with structural resistance

ENJ strongly bullishDon't miss this...
I won't add any comment on this.
---------------------------------
Good Luck

ENJ / BTC Trade Idea UpdatedENJ is bouncing on the support line. It might be a good idea to enter the enter with a tight stop loss below the support line or buy the breakout of the falling wedge.

#ENJ/BTC (June 05)ENJ will dump sharply in next days. Its bull run was done!
Expected targets of the dump that you can buy and scalp some profit are : 1700 - 1200 - 800
Don't catch any price except these prices

ENJ/BTCTriangulo ascendente formado en este par. Solo hay que esperar que confirme la ruptura de este.

ENJIN COIN (Enj Usdt) Short Term TargetIt has created 3 different trend lines since March. It has now touched the third trend line and is about to form a cup and handle. My first target is 0,23566. And if the fourth trendline occurs then second target is 0,3157.
In addition, the wedge formation that fell next to the trend line on the 2-hour chart has formed and is about to end.
This is not an investment advice. It is my own personal work. good luck to everyone.

ENJ / BTC Moving On A Parabolic CurveENJIN (ENJ) is moving on a parabolic curve which oftenly moves in parabolic price action and immediately sells off at the end of the curve. You can Google the term "parabolic curve" and see the symbolic chart which represents the typical price action.
Watch out the "buy the breakout" level and as soon as it breaks above, enter the trade and put your stop loss just below that level and let it ride.
Good luck!

Uptrend channel in ENJ/BTCHello Traders,
ENJ/BTC is inside an uptrend channel after breaking out.
On the daily charts, we can see a weakness to continue the uptrend movement, that is why we believe the price will test the support of this uptrend channel.
But we are seeing this asset on bullish momentum so expect the price continues the uptrending in the short term.
Best regards, Sandro and Gustavo.
Feel free to visit my pages if you would like to know more

Enjin Trying to Mine those Diamond Blocks 💠 | ENJIN ($ENJ)⛏️ It was only a matter of time before someone mashed up the block-based Minecraft with the block-based Blockchain. Well folks, the wait is over, Enjin has finally done it with their EnjinCraft plugin for Minecraft. This release shows Enjin is hard at work and that at least some of the past ENJ FOMO was warranted. That plus some mega bullish action since the COVID bottom has us looking for some levels for the bulls who want to mine those rare blocks.
Support ENJUSDT(Left):
First up we have the S1 S/R flip and orderblock cluster that includes a previous high. This is the first logical spot to look for a pullback. We have a similar formation at the S2 orderblock, although this level traces back to the pre-COVID crash range high as well. Lastly, the S3 S/R and orderblock cluster has acted as a major price pivot point and should provide support if it is tested. That said, all of these levels are logical and are likely to see a reaction of some kind if we see any kind of a pullback on the USD pair.
Support ENJBTC (Right):
The ENJBTC chart is very similar in terms of levels. First up we have the S1 S/R flip and orderblock cluster that includes the previous range swing high. This is the first logical spot to look for a pullback and has already seen a retest. We have a similar formation at the S2 orderblock cluster and S3 S/R and orderblock cluster. Again, like with the USDT chart, any of these levels are likely to see a reaction to price if and when we have a retest of them.
Resistance:
Although there is some valid resistance on the chart, the BTC and USDT pairs have both been so bullish we aren't concerned with resistance levels yet. With that said, we are happy to map out resistance levels if the chart gets enough attention. So if you are interested, let us know.
Overlook and Summary:
Getting a chance to buy any of these levels is likely going to be a bit like mining some of those rare diamond blocks in Minecraft, worth the time it takes to get to them. With that in mind, trends can always change, so if the trend does manage to give us too much downside volatility too quickly we won't hesitate to Alt+F4 this outlook.
Resource: cryptoticker.io
✨ Drop a comment asking for an update, we do NEW setups every day! ✨
Like, Comment & Follow to help the community grow 🎉🎉
