ENJ/BTC Possible IH&SENJ been ranging this low for almost a month, and now it wants out via inverted head and shoulders
I'll be watching it.
Enjin

Enjin CoinEnjoy
$ENJ looks like it has found strong support here with 1750-1800 holding well the past few weeks, and we can see it is bouncing off the .786 fib support as well, a floor has been established safe to say and a bounce is likely to follow

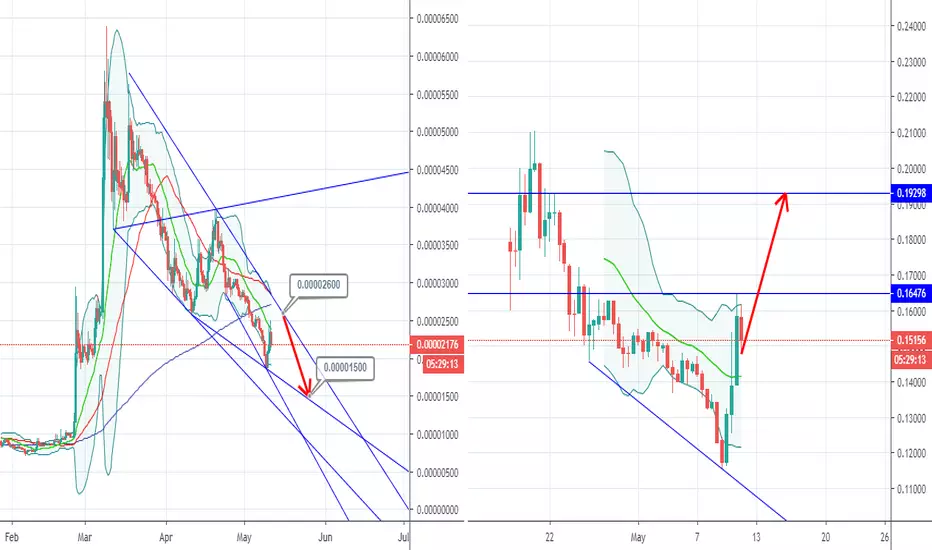
Enjin Coin After 795% Profits Run (Getting Ready To Move Again)There is no doubt that Enjin Coin (ENJBTC) entered a bull phase, the last wave increased its value as much as 795%, one of the strongest run so far. We also have the entire cryptocurrency market growing...
Let's take a look at the chart now!
ENJBTC moved down all the way to 0.786 Fib. retracement level, which stopped the drop, and is now starting to show signals of a potential low here...
The 0.786 Fib. retracement level from the last bullish wave also coincides with MA200 and EMA300, telling us that this is a strong support level with ENJBTC now trading above all these.
There is a little increase in volume, Sunday, so activity can be higher during the week.
The indicators are also looking good. They allow room for growth.
RSI:
Conditions for change: If ENJBTC closes below 0.00001600, the above signals are invalidated and a new analysis is needed.
Thanks a lot for reading.
Namaste.

Long awaited reversal for ENJI reall hope this is the bottom for long Enjin fall. It reached good support level and bounced. Might breakout triangle.
Keep in mind that Bitcoin bounced as well but it won't last for long as I expect it to fall lower to 4700 after it hit 5150-5200. So ENJ growth will be limited by that time.

ENJ bottomed out, low risk buy zone entry over hereShorts are trapped, price is finding support at previous swing low level of 1811 sats.
- Classic bottoming out pattern
- Entry zone: 1811 sats
- Stop loss: 1751 sats
- Target 1: 2044 sats
- Target 2: 2178 sats
- Target 3: 2442 sats
Good luck traders!!


ENJ/BTC let the ALTS runENJ looking to breakout of the falling wedge, it has fallen down nicely onto the previous resistance from its last run up, I'd be surprised if we don't see a break out here and a large leg up with the way alts are going ATM.

ENJ: DO or DIEENJ remain in this massive triangle pattern and is currently right on the edge of doom
It needs to bounce off the bottom of the triangle and make its way back up to test resistance
A break below could spell a deeper retracement but we are getting a bull div on the RSI so time will tell but it looks good for a trade here, tight stops

ENJIN COIN (ENJ/USD) - Buy After The Breakout!On the Daily timeframe, the price has drawn a bullish continuation pattern called Falling Wedge.
The continuation pattern is valid and active after the breakout. So, wait for a breakout confirmation on the Daily chart and the wait until the Daily candle gets a close above the pattern upper trendline.
The target is pretty high, probably you should considering take out some partial profits on the next strongest resistance levels but the pattern target is around $0.4
Feel free to support my effort by hitting the "LIKE" button, it is my only fee from You!
Have a nice weekend,
Cheers!


ENJ/BTC EntryHoping to get an entry around white boxes.
ENJ has been forming a base since early May, which is now starting to look like an Ascending Triangle.
I'm seeing higher lows and hope to catch an entry on the next one - if it occurs.
Recent rise in volume is a big plus!


ENJEnjin is looking good for a solid push up through the bands. Couple of bullish candles to show the way in the short term. Looking for about 25% gains..

Enjin it again !As all crypto traders know ENJ is a giant project. After the explosion of price in February, a big correction has occurred. Nowadays ENJ is regaining power and it might test 3k area soon.


ENJ : 75% Profits Opportunity in the Mid TermRSI : 56
Volume : Need some movement
H&S created
Accumulation Area : 1900 sats - 2000 sats
Distribution Area :
Target 1 : 2234 sats
Target 2 : 2564 sats
Target 3 : 2831 sats
Target 4 : 3097 sats
Target 5 : 3477 sats
Target 6 : 3961 sats
Stop Loss : 1700 sats

ENJ LONG- Entry : none
- Target : 4595
- Stop loss : 492
- Risk/reward ratio : 1.9 (if entry @ 1909)

ENJ/BTC + ENJ/USDT #ENJ $ENJ $BTC #BTC #USDT $USDT (12 May)#ENJ/BTC ENJ/USDT (12 May)
Yesterday ENJ increased very strong but in fact, it hasn't been able to breakout from its downtrend. To break this downtrend, ENJ needs to pass 3000sts or 0.2$ zone
Currently, what I can see is the ability to move sideways in the range of 2200-2600sts or 0.15-0.2$ and I suggest to buy and sell with targets in above charts
However, it's still not a good buying zone to hold long-term
ENJ/BTC - 4 Indicators Suggesting a Good Entry.Hello everyone! I hope you're well as usual, today I've discovered an interesting opportunity.
Quick disclaimer: I'm not held accountable for anything you do if you use my charts as trading signals, or a source of financial advice. My posts are simply thoughts and opinions, as well as information that can help educate people or spark discussions.
I'm excited to share with you my first post that isn't about BTC, but instead, an altcoin named ENJ, which is famous for partnering with Samsung.
Here's 4 Indicators I found that maybe worth an entry, let me know what you guys think in the comments below. The list are as follows:
1. Last Support Line at 1988 sats
2. Falling Wedge
3. Level 19 Oversold RSI on the 4 hour chart
4. Risk Management: 4.47-1 trade
1. Support Line
As you can see we've seem to hit the lowest level of support, and it's holding fairly strong as we speak. It doesn't look as strong as the others above it, but its the last one we've got, and if that fails we're looking at 1000 sats, back to its original sideways movement, worst case sceanario.
I believe its important to to consider every possibility. I predict that we won't break the support because alts are currently bleeding right now while bitcoin is currently having its spotlight moment at 6100 USD. BTC will eventually need to retrace down a bit, thus giving alts time to catch up again, in theory.
2. Falling Wedge
The support line isn't the only evidence to suggest we're bullish, we also have our 2nd indicator, the falling wedge. The falling wedge looks like its almost at the finish line, you can see its building up toward a bullish move.
3. RSI
Up next, we have the most important thing of all, the oversold RSI at level 19. This chart is on the 4 hour so you can clearly see its been like this for a while, the volume is telling us that its seriously oversold, which never stays there for long, or shouldn't at least.
When something is oversold, it quickly retraces back into to its comfort zone, which is at levels 30 to 70. At any moment, you can definitely expect a huge pump going vertically within a short span of time.
4. Risk Management
Last but not least, we have our risk/reward management analysis tool. Risk management is above all else. We're looking at a 4.47-1 trade, you have to ask yourself, how much can it dip?
We're almost touching the bottom at 1000 sats, there's really not much to lose, which is why the odds are in our favour, if you can find trades like that everyday, you'll be a billionaire.
In conclusion, I personally think we're going to hold the support, and then climb its way back up over time, whether it reaches the resistance or not its still a good entry regardless, and that's the key of being a good trader, your wins and profits come from good entries, otherwise you're doing it wrong.
Thank for your time ladies and gentlemen. Let me know what you guys think in the comments. Feel free to use my posts as an indicator for confirmation, or something you can use as a reference to your trades.
Twitter: @cyber_stocks
Discord: CyberStocks#9378
Feel free to support me, any help is appreciated. All funds will directly support my personal struggles, and most importantly, my mission of building an online brand :)
BTC Donations: 1AuZiofHSqM5gV1ttxUddNovDhEtHgMUgA

ENJBTCLooking at ENJ on the daily chart
* Hitting location on the .618 fib
* Nice double bottom
* OBV showing a bullish div
* Histogram showing a bullish div
* Willy showing a bullish div
* Low volume, so I would like to see the bulls step up and take control
* Still a big notch in VPVR that needs filling in at some stage.
I've all this is a very bullish chart and I like what I see
* Don't forget to hit that like button and follow me on Trading View and Twitter for more chart analysis :)

ENJ / BTC will need some time! Still can do 170% EOY 2019! ENJ/BTC had a heavy pump during the past weeks,
even tough it has corrected about 50% now.
It has come to a very strong support zone (previous high), which is a good point to buy.
Nevertheless the MACD shows some signs of weakness, so you should have stops in place.
The most likely way will be a slowly but steady uptrend to 8000 satoshi end of year 2019.
Trade it now on binance: binance.com/?ref=28929579


