$ENJUSD - Enjin could head downwardsHello everyone!
There is a strong divergence on Enjin chart, please be careful.
The price could drop down to 1.40
ENJUSDT

ENJ/USDT Massive Gains Incoming?ENG broke out of the strong resistance and has a bullish harmonics with some remaining take profits!
Buy / Long here and DCA in the box area and sell at $1.7, $1.75, $1.8 till $2!

Enjin Coin Daily & Weekly AnalysisI did the weekly and daily analysis of Enjin Coin. I think the rising trend will continue, so I took a position in the 1.60 region for the targets I specified.
Those who wish can place orders in the $1.45 - $1.60 region, and those who wish can buy markets. Let everyone manage their own risk.
$1,780 can be considered as a profit buying point for short-term traders and those who want to open a long position.
However, I do spot purchases. I am considering placing split orders in the $2,192 - $2,645 zones.
Those who wish can take the main money in these regions and put a stop to the entry area to follow the continuation.
It is not investment advice. Those who want can evaluate it at their own decision.
BINANCE:ENJBTC


CRYPTO - ENJIN - Bull Flag almost finished. Bull pin on 4H. CRYPTO - ENJIN - Bull Flag almost finished. Bull pin on 4H.
Looks like the bull flag is completing with serious volume on the green candles. Bull pin is great confirmation.
Target 1 = 1.90
Stop 1.44.
Basic Breakout On ENJENJ is clearly signaling a bullish pennant on the weekly chart. It is also nicely holding the 50W EMA for its history.
Looking for rising volume and a breakout of the pennant pattern to the upside, which looks to be around the 0.382 Fib level at approx $2.
The next Fibonacci targets above the ATH are $6, $9.20, $12.50 +

ENJUSDT Technical Analysis
⏳ Spot
💎 ENJUSDT had formed a descending channel. After the break out above the channel it can go for a retest the previous resistance if it get rejected it would continue to go higher.
🏁 Short & Medium Term
💵 Invest Only 5% of your Portfolio
🎳 Entry at market or 1.400
☕️ TP1 1.650
🍺 TP2 1.800
🍻 TP3 1.980
🍾 TP4 2.180
🍷 TP5 2.400
🍸 TP6 _____
🍹 TP7 _____
🎁 TP8 _____
🚫 SL 1.290
Good Luck 🎲
Check the Links in Description and If you LIKE this analysis, Please support our page and Ideas by hitting the LIKE 👍 button. ❤️ Your Support is really appreciated! ❤️
Traders, if you have your own opinion about it, please write your own in the comment box. We will be glad for this.
Feel free to request any pair/instrument analysis or ask any questions in the comment section below.
We will have more FREE forecasts in TradingView soon
Have a Profitable Day

ENJUSD eyespie a laggardstill 12% to the .618 from here
am sure this one will get in on the fun soon enough
missed snx and sushi and aave
3 of my favourite coins whilst i was busy getting chopped up byy fake ltc news
frustrating but theres always other oportunities

Enj"Play and earn" was The most enjoyable sentences that I did love to hear when I was younger.
Nowadays Game tokens are growing great like Axs, Gala and so more.
The technical chart is on a good form and much more important point is that the whales are accumulating ENJ faster than before.
I believe ENJ is the next one and it can raise at least to 14usdt in the next upcomming months.

ENJUSD Bullish Case (Weekly Timeframe)This is a very fascinating coin at the moment!
Price at the weekly uptrend support zone!
Even though (technically) the overall structure is bearish but we can ignore the presence of such a strong weekly support!
If the price bounces northwards then this might be a very good indication for bullish moves on ENJIN Coin!


ENJ/BTC MA Structure This formation of moving averages layered 50,100,200 is a great candidate for bullish action
This is shown in right slide, which is BTC's legendary run to 20K in 2017
Enjin on the left is showing the same MA state hinting at bullish potential
As its easier for price to move upward with MA's like this, the path of least resistance is taken
I am long ENJIN

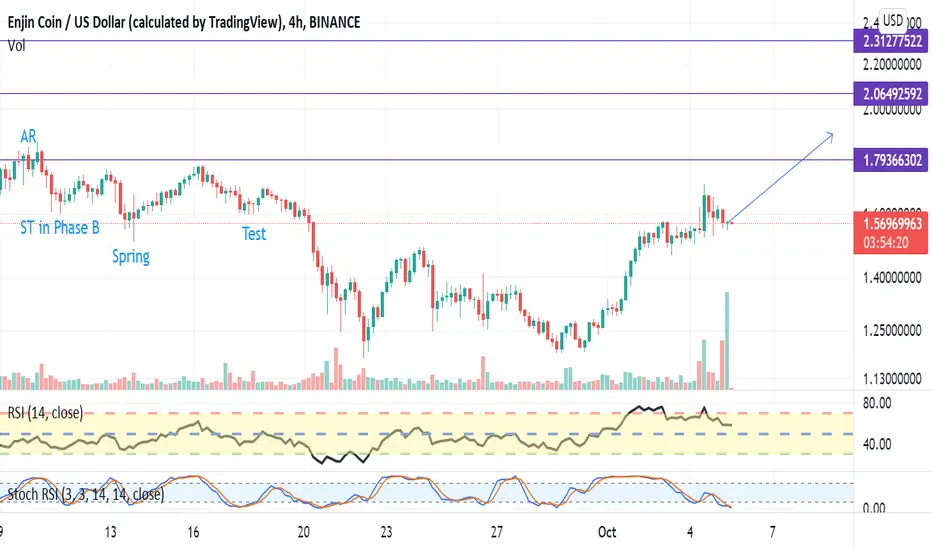
CRYPTO - ENJ - Another Wyckoff with the hard yards behind us.CRYPTO - ENJ - Another Wyckoff Accumulation with the hard yards behind us. We have moved through to the test phase.
RSI setting higher lows showing selling strength is weakening.
Volume is increasing.
STO has bottomed out and is heading back towards 80 for another run.
We should head towards 1.80 for the sign of strength phase of the wyckoff and then back through 2.00.
Target 1 = 1.99.
Stop loss 1.49.

Quick 80% move in ENJEnj is holding and support and is ready for another push up. Buying enj here and will be holding till the target hits

ENJ/USDTEverything is clear in the picture. Ask your questions in the comments section. Please like, good luck🤍🚀

ENJUSDT , what should we do now ?Hello guys
whats up ? everything is okey ?
We are faced with a complicated chart
The trend of chart is downward trend and in here we are encounter with the first support
when the trend is downward we should take short position but because of market that is bullish in few months later we should buy and hold and take long position in sensitive area
Futures traders should take short position if first break and pullback then take short until reach second resistance if you wanna take long position wait until the trend want to change and after that you can take long position
For holders : guys buy some of ENJ in every support area and hold it until the last resistance break then you can sell it
ENJ coin is one of the best coin in crypto ( its base for games )
Fundamental is important
dont forget stop loss
if you have any question ask me with send me mesaages
Good Luck
Abtin

$ENJUSD - Falling wedgeHello everyone!
ENJUSD is about to complete the correction and breakout from the falling wedge.
As a rule wedge has a 5-wave pattern, however to go long, wait for the breakout from the wedge and go long.

Long ENJ I believe that ENJ is following this pattern, what do you think of the following trade
Entry: 1.54 - 1.68$
TP1: 1.783$
TP2: 1.94$
TP3: 2.184$
TP4: 2.36$
SL: 1.44$

Enjin is Ready!Last time to accumulate at these prices before it breaks all-time-high.
Enjin is one of the biggest NFT and gaming platforms
I hope you found the idea interesting:)

ENJIN - How our Levels worked During today's 'Storm'Massive dip today, probably well orchestrated too with billions of dollars lost in liquidations.
Let's take a step back and see how our levels works.
Look at our previous ideas below for comparison.
No love today,
the FXPROFESSOR

ENJ will touch $5#ENJUSDT
$ENJ broke out from a strong resistance, it may continue its upward move from here or maybe make a correction move .
based on fib levels the min target is $3.2 and I think this powerful coin have potential to touch $5.3.

ENJUSDT updateENJUSDT: A little less than a week I gave out my trade idea like this, and it played out perfectly. 10% gain unleveraged. A nice win in my books

Chart 4H and chart 1H synchronizedsqzmon and adx 4H & 1H synchronized
Target TP1:
not financial advice
