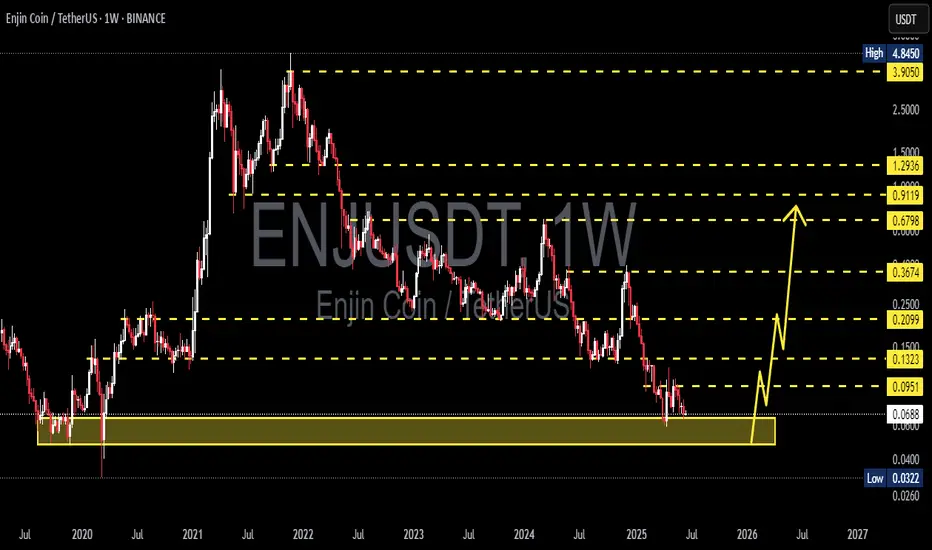
ENJUSDT 1W AnalysisENJ ~ 1W Analysis
#ENJ Buy back gradually from this support block with a short-term target of at least 20%++.
Enjusdtlong
ENJUSDT 1D AnalysisENJ ~ 1D Analysis
#ENJ Buy after successfully breaking through this resistance line with a short-term target of at least 10%+.

ENJ Spike 63% Gearing For 300% Surge Amidst Bullish Flag PatternThe price of Enjin coin ( NYSE:ENJ ) broke out of a bullish flag pattern surging 63% for the past 24 hours. With growing momentum, the asset is gearing for a 300% breakout.
One key factor contributing to the surge is the launch of the Enjin NFT SDK, which enables seamless integration of non-fungible tokens (NFTs) into various platforms, paving way for NFT's on the ENJ ecosystem.
As of the time of writing, NYSE:ENJ is up 19% setting the course for a 300% breakout. The asset has formed a perfect bullish flag pattern with the ceiling of the pattern already broken, NYSE:ENJ will be aiming for the $0.32 resistant and beyond.
With growing momentum as hinted by the RSI at 71.89, NYSE:ENJ might just be the asset to look out for this week.
What is Enjin ( NYSE:ENJ )
Enjin is a blockchain platform that makes it easy for developers to integrate NFTs and digital assets into their games and apps.
The platform provides tools for creating wallets, minting tokens, and managing transactions without requiring users to understand complex blockchain technology.

ENJUSDT 1WENJ ~ 1W Analysis
#ENJ Buy gradually from here if you still have a Conviction on this coin with a short -term target of at least 20%+.

ENJUSDT 1WENJ ~ 1W Analysis
#ENJ If you still have a Conviction on this coin. Maybe this support you can consider to start buying back with a short -term target of at least 20%+.

ENJUSDT 1WENJ ~ 1W Analysis
#ENJ re-testing this support, If you still have Conviction on this coin, buy from here with a target of at least 20%++

ENJUSDT LONG TERM ACCUMULATIONENJUSDT ACCUMULATION
have been using ENJ services for years now as a wallet user, have been very satified with the services provided, hence its one of its working proiduct , i would bet on them for a bright future.
Previous Idea:

ENJUSDT 1WENJ Update ~ 1W
#ENJ At Time Frame 1W,. Once again it was rejected from this resistance line. If you still have Conviction on this coin,. You can start buying gradually at the current price. or if you want to play more safely,. You can buy on this support block..
these two scenarios with a minimum target of 20%+

#ENJ/USDT#ENJ
The price is moving in a descending channel on the 12-hour frame and is sticking to it greatly and is about to break upwards
We have a bounce from the lower limit of the channel at a price of 0.1240
We have an upward trend on the RSI indicator that is about to break, which supports the rise
We have a trend to stabilize above the moving average 100
Entry price 0.1500
First target 0.1908
Second target 0.2208
Third target 0.2697

ENJUSDTENJ ~ 1W
#ENJ If you have Conviction on this Coin,. This is the right time to make purchases in stages.

ENJUSDTENJ ~ 1W
#ENJ If you have Conviction on this Coin,. This is the right time to make purchases in stages.

ENJUSDTENJ ~ 1W
#ENJ If you have Conviction on this Coin,. This is the right time to make purchases in stages.

Target 0.1587Following daily chart.
Entering a bit late but his is what it is.
Also it doesn't have a good ratio.
TP 0.1587
SL .0141
Around 6% profit.

#ENJ/USDT#ENJ
The price is moving within a 12-hour downtrend channel that it is firmly committed to, and has just broken through
We have a support area at 0.2400 and we bounced from it at the lower border of the channel
We have a tendency to stabilize above the Moving Average 100
We have a bearish RSI indicator and it broke higher
Entry price is 0.3080
The first target is 0.4320
The second target is 0.5146
The third goal is 0.6343

ENJ USDT Long Idea - Bullish Reversal ENJUSDT 4-Hr TF. Bullish Reversal
We observe a budding shift from a prevailing downtrend to potential bullish momentum.
Key support and resistance levels have been mapped, indicating areas of significant market interest.
Price Action:
Recently, the price has shown an upward momentum, creating a series of higher lows and higher highs, which suggests a potential shift in trend from bearish to bullish.
The recent pattern of higher lows and highs could suggest an imminent trend reversal.
Our strategy recommends a long entry at 0.5685, with a conservative stop loss at 0.4270 to safeguard against unexpected downturns. Profit targets are set at 0.5300 and 0.5500, aligning with major resistance zones.
The RSI presents a neutral stance with a bullish bias as per the moving average crossover. Traders are advised to monitor these levels and adjust positions accordingly to market dynamics."

#ENJ/USDT#ENJ
The price is trading in a large descending triangle
About a year and a half ago at the level of 0.2150.
There are bearish reversal triangle patterns inside the large bearish triangle
Finally, the falling trend was broken and the rise began
Expected goals: 0.5800 From the current price 0.2600
Which represents 200% of the current price
All of this is backed by a big volume rally

ENJUSDT 3D LONG📈Hello everyone. Timeframe 3 days. ENJUSDT is at strong support and has formed a triangle. The output can be strong. I am considering going long on a breakout/retest of a trend line. Marked goals and levels.

ENJ to 0.55?As we can see Enj breaking little down trend which was holding since May, and this could be bearflag pattern. I'll be taking profits at those green marks.

ENJUSDT - W1\D1ENJUSDT
W1 - The price was able to break through the high of the first wave, which may mean the implementation of the 3rd wave. The best option for considering purchases is to wait for the level of the first wave to be fixed or for a retest to D1 at the level of 0.3319. When implementing the idea, you can expect a target at the level of 0.5451
D1 - you can wait for a corrective movement within 50% of the previous impulse and expect the formation of the 5th wave - from levels ~0.3172 with targets up to 0.3942
What can you expect?
Expect the formation of the 5th wave - from levels ~0.3172 with a small risk on the idea with a target of 0.3942
Cancellation of the idea when fixing behind the trend line 0.2991
Long
Targets 0.3407 - 0.3652 - 0.3942

ENJUSDT - W1\D1ENJUSDT
The price was able to break through W1 - the trend line. The best option for considering purchases is to wait for the trend level to be fixed; a more convincing option for purchases would be a retest of this level of 0.2390.
If the price is not fixed behind the trend line, you can expect the price to move down to the level of 0.2040 - from which you can expect a rebound and consider buying.
What can you expect?
If successful fixation behind the trend line, you can consider entering from the nearest levels of 0.2390 with a small risk on the idea with a target of 0.3670
It is better not to take increased risks; a correction is being traded. Cancellation of the idea when the low of the 2nd wave is broken.
If the price does not consolidate, then wait for the entry point at the level of 0.2040 and below.
Long
Targets 0.2860 - 0.3025 - 0.3360 - 0.3670

ENJUSDTBINANCE:ENJUSDT Long idea
⛔"Daily crypto market analyses I provide are personal opinions & not financial advice. Trading carries risks, so do your own research & seek advisor's help.#DYOR"
Don't forget to like and comment

ENJUSDTENJUSDT was trading under declining trendline and recently it seems like bulls are starting to take the charge and has given the breakout from declining trendline with significant bullish candles .
Currently the price is retesting the broken trendline , if the retest level holds it could be a nice buying option.
What you guys think of this idea?

ENJUSDTENJUSDT was trading in range bound structure and and bulls took the charge and sharply and strongly break the range and break the local declining trendline as well.
If this breakout holds the next easy target for bulls can be 0.300
