Entry

REP USD Entry Reward to Risk 2:5:1The top of the ascending triangle is broken. I expect gains equal to 80-110% of the height of the triangle. First target is marked in blue.

ETC Entry Point Reward to Risk R 2.5:1 Ascending triangle formed if the top is broken I expect a rise that equals 80-110% the height of the triangle. This will also bring us to right around the swing high.
First target the fib in between.

NXT Entry Point Nice Reward to RiskR 5.5:1Waiting for a break above the triangle. Lots of room to run now that the FUD about BTC futures seems to have fizzled.

NXT USDT Updated Another Bull Flag Entry PointHello again!
NXT is turning into the king of December with setup after setup giving us great entry and reentry points.
We're currently in another Bull Flag/Bull Pennant.
A break above the top would signal an entry point - A word of caution on this one though. We're right below the longterm trend line, so I could enter at .695 only to see us bounce off the longterm trendline at .72; however the overall trend and fundamentals are so bullish on this coin that I'm not overly concerned.
If we make it through the trendline:
Target 1: previous All time high (I'll be taking 25% off the table here)
Target 2: The length of the flagpole added to the top of the flag (note: the pattern suggest a gain of 80-110% of the flagpole, so I'll be keeping an eye on this range for reversal or consolidation, either of which will se me taking another 25% off the table).
Target 3 is the extension of the Fib, it's also right below the $1 mark which should be a significant psychological hurdle.
Overall, note: I pretty confident at this point that this coin will go over $2 this month, with a reach goal of $5. All of these entries and exits are meant to increase my pile of NXT, while protecting my trading bankroll.
See my previous ideas on NXT for an explanation of the Ignis air drop on the 28th or to see how my other trades have worked out.

BTC Entry R:R 3.5:1 Looks like we might breach the top of a Bull Pennant (this needs to be confirmed by making a new local high), if so we are headed to 20K.
First target and final target marked on the chart.
We will be protected on the downside both by the icould and the icloud baseline.
Caution: if the bottom is broken rather than the top, we could be in for a deeper correction, so buy at the bottom of the triangle to squeeze out a couple extra % of profit would be a really bad idea.

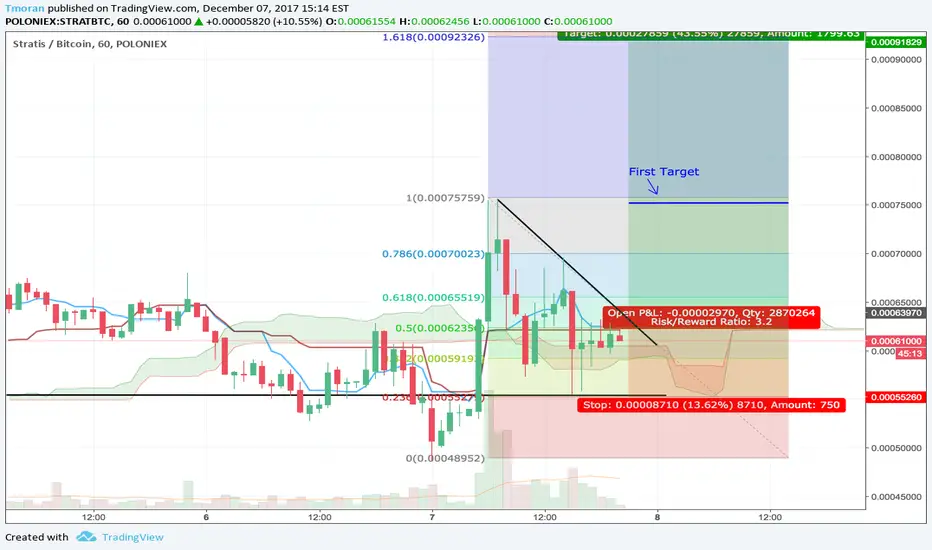
STRAT BTC ENTRY Reward to Risk 3:1 If the top of the descending triangle is broken it will be a very bullish sign and I expect we will quickly run up to the recent swing high of about 0.00075 BTC.
This will be the zone of take profit 1, where I'll cash out 50% of my initial trade and adjust my stop-loss up to my entry point.
Final Target is the 1.618 Fib extension.
Note: The downward sloping upper side of the triangle must be broken for this theory to be valid.
Trade responsibly; don't forget your stop-losses!
ETHUSD Update Good for Day Traders, others look for lower entry ETHUSD Update Neutral in near term but still bearish whilst trapped under 440
Very interesting price action here: having sold at 468/9 we were waiting to see if ETH could hold up above the lower
parallel...it tried so hard for a few hours but eventually it succumbed...failed breaks: remember the pyschology gone
over in past posts...day traders are out almost immediately an ETH dives to find structure to left, losing the line at 446 like a
hot knife through butter, finding support around the next line of support at 433/target level for bears to close out shorts
with a low at 432 (mid structure here, so far) on the chart. Although day traders have bailed out some have bought back
lower and others, bemused by the price action remain long...the pattern is confusing in the very near term at that
point...bulls say it's cool, spike down, correction done, it's OK so long as 446 holds it up ...those looking at the bigger
picture are not so sure ...we did the right thing to trap in profits close to the highs of the run: and not to get trapped at
the 480 levels even though it was looking fine for a few hours before failing. It was OK to close out shorts at 433 too. But
this pattern is not healthy now. ETH has not finished its rinse out by look of it. More stale bulls need taking out, still,
before this is ready to rock again...it's till under pressure whilst unable climb back above 440 and hold up there...432
must hold now if ETH is to have a chance of stabilising here. Any failure here will tip ETH back into bear territory, forcing
price lower to 418 and likely spiking as low as 410 before rallying back to 432/3. Annd if at any point 410 gives way
by more than 3points look to shoort again on next pull back to 410 fr another decline to 385. Good trades here so long as we
follow what the chart is telling us. Initial resistance at 439-440. Needs to break above here and hold before the bears
will let go, then it should run up to 446-8 again and come off one more time from there.
Good moves for day-traders here but for swingers and those looking to buy this at a good price it looks like we'll get
a better chance from lower down if we wait, and not be tired by waiting, etc.

STORJ going for its final legSTORJ has broken out of its downchannel a month or so ago and made two nice waves with deep retracements each time. It might bounce up and down the trendline for a bit more time, but at this point STORJ is already oversold on the 4h and daily charts, so one of these days we could expect a good move upwards towards the upper trendline.
Entry at this point and a stoploss a bit below the blue box would be a nice setup.

Dash/Dollar: DASHUSD Entry levels/Strategy ReviewDash/Dollar DASHUSD Strategies Reviewed
Time Always Tells
The 2 possible entry strategies yesterday gave one great result and for the other the jury is still out.
You'll be familiar with the story about the old bull and his boy out on the range: the young bull sees a herd a beautiful
looking cows in the valley below and says: Dad, look at those babes...that one looks like Adriana Lima! Let's get down there
and...you know the rest.
That was Dash yesterday - don't chase, it might just come to you and eat right out of your hand.
Sure enough some smart traders stuck a few lazy orders down at 302 (entry was actually placed just above the break
level/previous spike low on Thursday at 302.8 but it looks to have come down to 300 low) - and then ripped 57 points or 20% in a
near straight line in less than 6 hours...makes Bitcoin look quite tame at the moment.
That was the good choice, the older, calmer way to go.
The other choice was follow the break-out above new structure at around current prices now, 338-342.
Then we have to keep an eye on price action to see how it behaves after the breakout, obviously. And here, it has to be
said that follow through is lame, so far. We're in a weekend too. We can see those two spikes that have recently formed,
showing quite strong rejection from just under 360, so am concerned here that if it breaks back down below 335 now, it
will likely fall away on lack of buying interest to 318 at least and quite possibly it can spike down to 302 again before it
rallies...this break-out has failed, so far. That's what the chart is saying, and Dash needs buyers now to push it higher
still, otherwise it will start to fall away. So need to put a tight stop under this, if long and day-trading, at 328. If hit, then
put a buy order in at 305 with stop just under 296 and see if it gets filled.
Longer term
The sloping head and shoulders pattern here is similar to the one on Facebook, in this case with a minimum upside target
at 453, with the most likely points of resistance on the way marked on the chart. It's good medium term. But be careful of
whipsaw between 302 real support and 340 reistance in the very near term. It's a good tradeable 10% range for day-
traders once 330 gives way...that's where they're most likely to step in on short side, so use stops, looking to get long again
from lower down if 330 gives way.
Moral of this dumb story: sometimes it pays to be cool and calculating and sometimes it also pays to follow the herd and
play momentum breaks. But a momentum break needs careful watching over on the day following the break: did volume
spike on the break out? Has it had follow-through? Are there any scary pin bars forming showing quite strong rejection at
higher levels...? You knew all this anyway. Don't trade on hope. Trade on what the chart tells you. If you can manage to
master this Zen-like state, you are free. It's not you. It's the chart.

Ethereum/Dollar: ETCUSD - entry points Ethereum Classic/Dollar ETCUSD
Nice continuation patterns here giving quite clear entry points
on each break above each little pattern.
It's just had a good break and is a little overbought - so can't
chase it here - instead, suggest 'going fishin' (as with last Dash
comment which yesterday worked perfectly) - put an order in
just above 15.24 break out level and maybe later in session
the fish will swim to the bait and bite and maybe it won't.
Eventually this looks as if it will move back to retest the highs
around 23, with each level of most likely near term
resistance, shown on chart....let's see if the fish bites

Bitcoin; BTCUSD Last valiant chance to go long with stop closeBitcoin
A fantastic point perfect test of the parabola has held up
Bitcoin so far. It's rallied to 7150 and stopped, coming back
down to give a buying opportunity close to 7080, so look to
buy as close as possible witha stop under 7050.
If this ends up failing, we've had a valiant try and a faily small
loss compared to potential gains if this is the to be the low.
And if it isn't please refer to earlier comment for shorting
strategies.

USD/JPY - Aggressive 6H Entry (Trend-Change)USD/JPY - Aggressive 6H Entry (Trend-Change)
@: 113.692
S/L: 114.445 (-75.3 PIPS)
T/P: 112.130 (+156.2 PIPS)
Risk:Reward: 2:12-1
ENTRY: We have seen our 6H candle close -BELOW- our major trend-line indicating a trend-change. As well as our 8H and 1D candles of closed -BELOW- as well. We are looking to potentially reach our Minor Support of 112.130 area.
S/L: We placed our Stop +10 PIPS above our Minor Resistance area of 114.355.
EXTRA: Usually at this time of day the market can be kinda slow, and we can see a potential draw-down. However; we don't have anything to worry about. If price were to manage to get hit, we will possibly we in a trend-change to the upside and recover our loss if that were to happen.
*This is NOT a signal, we are NOT responsible for any type of losses you may encounter. For inquiries on our Advance Training please email us at TheForexClubFX@gmail.com

Bitcoin: BTCUSD Last chance for low risk entry approachingBitcoin: BTCUSD Last chance for low risk entry coming up
See how the old (now dead) rising support line is still trying to kill anything that comes near it? It's still toxic...
You can see why day traders are wary of it, especially as it coincides with fixed overhead supply at the same 7350 level.
(This stuff takes too long to write and too damn often what I think is about happen, HAS hapened by time it's finished
...very trying, especially as Bitcoin moves between 10 times and 1000 times faster than any other instrument on the planet.
It was already on crack. Now it's doing steroids too. It's Jaws on crack and steroids and we've got it on the hook...maybe
If you were slick enough to get long lower maybe you were slick enough to exit too??? If not, it's OK.
We need to move away from that old toxic rotting line of rising support/new resistance, the left-overs from an old trail, to
stay in outlaw-chasing mode....well there's not much selling going on from 7350 so far...ideally Bitcoin will trade sideways
to down for a while and start to build support off 7260-7245 range and from there start to rise again. Look to buy/add
from this range if tested. Will still be using a tight stop though just below 7220 just in case that old resistance line proves to
be so strong it''s unsurmountable. If it gets struck, the risk is about 50 points. The potential reward is incalculable at present.
It's the only financial instrument in the world you can say that about. Everything else has it's value, pretty much. Good luck!

GBPAUD out of range, buying retest - Price has broken above the S/R area around 1.7150.
- Showed nice reactions to the the support area.
- Nicely pulled back to the EMA.
- Idea: 1d. Execution: 4h.

Great entry to go long on DNT!Really nice chart. This coin had its pump and was then dumped and is now back for business (lol). Anyway, volume is descending whilst the price is making higher highs which is a bullish sign. Marked possible resistance levels with the blue line. Don't take the yellow line for granted it's just there to visualize things. In fact, we will probably see a more sideways chart.
But the point is that this looks like the perfect entry to go long on DNT. They have a very active and transparent team.

Triple top downside breakout LTCBTC trading plan.
The general alt context is the one of a very strong correction. Some major cryptos broke (yet) historical support levels, LTCBTC -4.43% just broke the 0.010 line that supported the price since may.
It confirms the Triple top pattern. The trade has, seen the context and the major break, an high probability of success. We well use the maximal amount of money allowed by our money management.
Black lines on the Charts represent the different magnet levels given by ichimoku (Use higher TF flattened SSB -0.22% levels), the -20% level is the target given by the Bulkowski rules for tripple top patter trading.
We enter now as the break happened and add on pullbacks till 0.010 AND on rebreak lower. This alt counter rally is EXTREMELY strong. I see no or few pullback coming. Stop slightly above 0.010. The plan is to trade only this leg down for the moment.
Trade risk reward is around 3.
We'll be cautious around 0.0084 as a resistance stands at this level.


5 LTC entry indicators Coin - LTC/USD
Entry 50.25 & 51.70
Targt #1 - $69
Target #2 - $79
Stop - 46.75
5 Entry Reasons
Strong FA
LTC is a highly traded Alt coin with one of the largest most consistent growths for the year. The fundamentals are strong and Charlie Lee is very committed to the crypto space and the LTC project.
Elliot wave -
We have completed a full market cycle and seemed to be in a horizontal consolidation pattern after the bear correction.
RSI -
When BTC was at its previous ATH of $5k, LTC reached an ATH of $100. On the retrace BTC dropped to 3k and LTC down to $40 which showed more drastic overselling. Since then it has continued in an equilibrium pattern with lower highs and higher lows which is a sign of strong consolidation. However has BTC has completely retraced and gone to new ATH, LTC is still at 50% of the ATH(imagine BTC being at $2,500) and supported by the .236 Fib while the RSI had a double bottom on the over sold
Trend lines -
As we know trends are strong indicators of market direction. There is a long term bullish trend line that supports our purchase point that dates back to march. Also the bear trend line broke around 9/25
Volume -
We had a significant increase in volume after our entry launching our trade in the direction that we want. Volume brings momentum.
All of these alts hide in the shadow of BTC. As long as we don’t see any major sell off in BTC then we should be able to continue has planned. If we have any major BTC sell offs this could drastically impact our trade and stop us out, or cause new entry points.
Big shout out to @sean_vengan who posted this trade first. This is a live trade for me at the posted prices. Excited to see how this plays out!

NZDUSD 1d pullback, sell the retest - Price lost the 0.7150 area, which had served as support since June.
- MAs are valid.
- Price is currently approaching the S/R area, pulling back towards the EMA.
- Sell the retest.

AUDJPY 1d pullback, retest - Price is making lower highs, lower lows, coming from ~90.00.
- MA crossunder.
- Price broke the 88.00 area.
- Currently retesting S/R area, EMA.

Shitcoin: SANUSD This is a nice RoC / SRoC entry setup which has often good r/r with a high pivot chance of the low here
