Cobalt prospecting for EV play breaking out on wedgeCBBWF
Cobalt and Silver prospector and formerly Global Copper Group...Cobalt sexier asset.
NAFTA sourcing for Co/Ag play. Has assets with cobalt for EV, electroplating, electronics, metal alloys.
Trend in electric batteries to solid state batteries, which Cobalt will remain sexy for next decade despite Elon Musk hope in Lithium and threat to keep prices down. Not sure his comments are working for him.
Entrypoint

GBPY/JPY still look for sell stop, Good morning guyscan't give too much info but hope the short Idea helps

Tetra Tech Corp. on 3rd falling wedge, await 7 life cat bouncewatching for entry, pulse, dead cat falling wedge for 3rd cycle (2014, 2016, 2018)...TBD
About: Terra Tech Corp. operates as a vertically integrated cannabis-focused agriculture company. The company operates in two segments, Herbs and Produce Products; and Cannabis Dispensary, Cultivation and Production. The Herbs and Produce Products segment offers hydroponic herbs, produce, and floral products. The Cannabis Dispensary, Cultivation and Production segment operates medical marijuana retail and adult use dispensaries under the name Blum, which provides a selection of medical and adult use cannabis products, such as flowers, concentrates, and edibles; and produces and sells a line of medical and adult use cannabis flowers, as well as a line of medical and adult use cannabis-extracted products comprising concentrates, cartridges, vape pens, and wax products in California and Nevada. Terra Tech Corp. was founded in 2010 and is headquartered in Irvine, California.
$122M Cap, down 52% YTD, $38.5M rev. 7-1YOY, rev gr. 38%, 127K shares bought by insiders last 2 yr. (strong), Inst. MF hold 0%, while wealth manag. <1%, so mostly private investors, so high upside if legallized, earnings range -0.30 (3/8) to 0 (1/8), so still not profitable pop needed (11/7/18 next announcement). 8.7.18 was -0.17.
The rapidly rising demand for Cannabidiol (CBD) and Hemp based products is showing no signs of slowing down as expectations to push both markets into new territories with exploding sales value in the next coming years. The global industrial hemp market size is expected to reach USD $10.6 billion by 2025, according to a new report by Grand View Research, Inc. and the market is anticipated to expand at a CAGR of 14.0%. The North American CBD market is primed for expansive growth across its three primary sectors, hemp-derived CBD, marijuana-derived CBD and pharmaceutical CBD. With recent developments and advancements in the hemp industry, farmers across the country are turning their attention to commercialization looking for the road to profitability. Increasing R&D activities to develop perfect agronomy and new genetics of crops to obtain high yield and improved product quality are expected to have a positive impact on CBD - Hemp production. Active Companies from around the market with current developments this week include: Marijuana Company of America (MCOA), Inc., GrowLife (PHOT), Inc. MPX Bioceutical Corporation (CSE:MPX) (OTC:MPXEF), Kush Bottles, Inc.(KSHB), Terra Tech Corp (TRTC)

Consolidated Communications Holdings Cup&Handle about to brkout Watch for breakout: 9.26.18 2:30pm
CNSL is about to come out of a weekly cup and handle formation or minimally a double bottom, which both usually rise upward.
Small-cap telecommunications stock adding fiber optic lines and hurt by earnings after infrastructure investment.
* Compares to: CBB FTR CMCSA T
* Pays 12% Dividend yield currently, so little risk. Ex-divident is Oct. 12th. payable Nov. 1st and quarterly.
* Potential to double on Fibretracement to $24 into early 2019 and upward by end of 2019 into 5G massive MIMO communications and fiber optic cable lines for markets served.
* Will be positioned to grow into 2019 with dividends and then catch 5G services growth and target by year end 2019 likely $28-30, as Telecom stocks grow when profits made.
* EPS Growth was -386800%, just indicates it is making progress with profitability vs industry average 144%, but it is a small cap.
* Mkt Cap $914M, 2018 sales will be $1.4B, that's a bababa-billion. Enterprise value with recent upgrade is paultry 3.25B, or shows undervalue ratio 3.25/0.914 = 3.55 and poised to grow customers. Book value buy?
* Debt however is high and will reduce with growth as small-cap to mid-cap (expected for market and opportunity).
* Insider buying is small, but a positive 27,000 shares/yr. last 2 yrs.
* With telecom & cable industry at current prices not sure if it'd be an acquisition target?
About CNSL: Consolidated Communications Holdings, Inc., through its subsidiaries, provides various integrated communications services to business and residential customers in the United States. It offers a range of communication services and products that include local and long-distance, high-speed broadband Internet access, video, voice over Internet protocol, private line, custom calling features, security, cloud, data center, managed and IT, and directory publishing services, as well as engages in equipment sales activities. The company also sells and supports telecommunications equipment, such as key, private branch exchange, IP-based telephone systems, and other hardware solutions, as well as offers support services to medium and large business customers. As of December 31, 2017, it had approximately 972 thousand voice connections, 784 thousand data connections, and 103 thousand video connections. The company serves customers in consumer, commercial, and carrier channels.

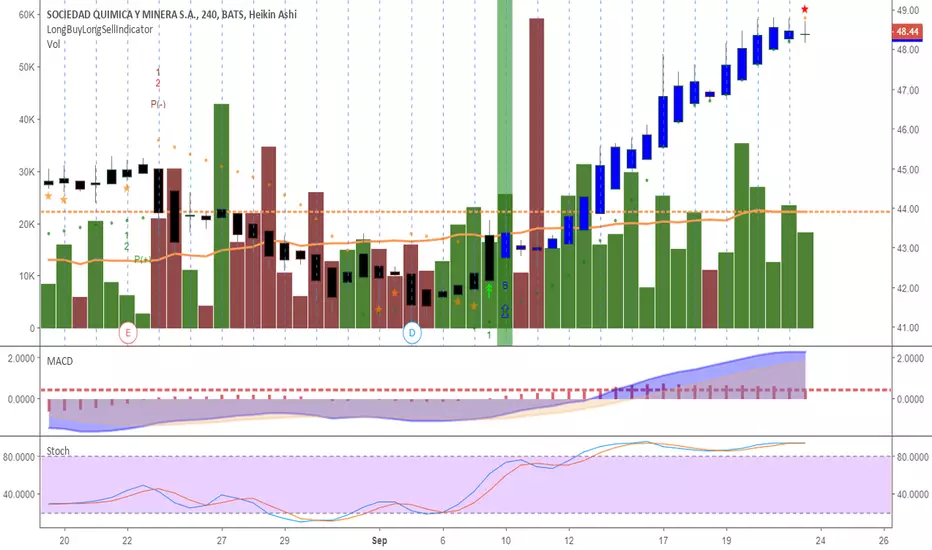
Lithium EV Battery Growth - Chilean to US$ plusSQM NYSE:SQM is a chilean Lithium mining stock for
EV Batteries and takes advantage of US$ to Chilean value as well. EV Truck manuf.
just starting and will require more and more lithium.
Another big news story that hit the market in the second quarter was worries that Tesla
might not be able to deliver its Model 3 on time due to a battery shortfall. This is
another sign of supply and demand will drive up prices and profits.
Here is 4hr. chart showing solid entry, which already in below $44 and buying up to $50.
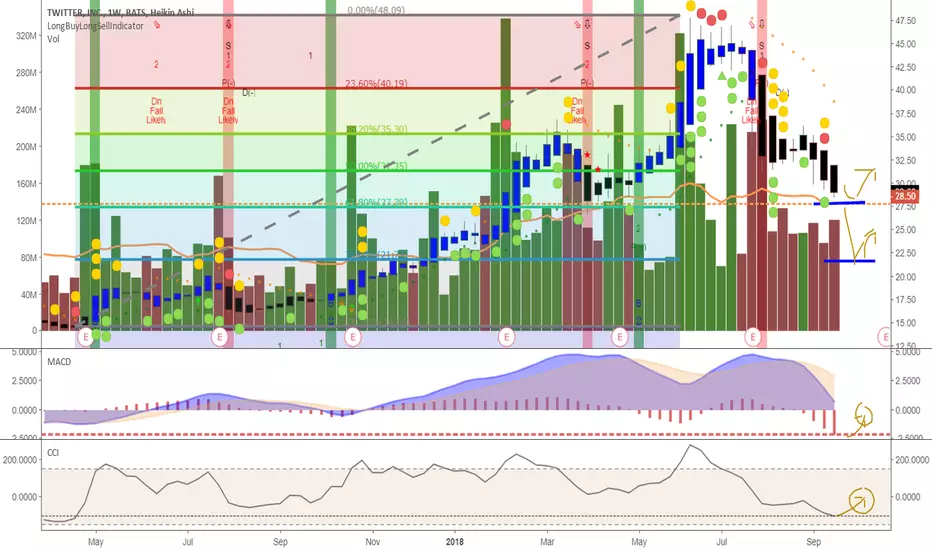
TWTR fibretracement entryTWTR
Fibretracement for 27.50 or 22.50 entry.
Watch for longbuylongsell and 1w chart here, change to 1d/4h for best entry with CCI and MACD (volume)
WTI (CRUDEOIL) – Believe it or not: still preparing for 80+!Hello everyone,
When looking at the chart, we see a zone of strong support, because WTI was coming back three times to this level (between 63.60$ and 68.60$). So, we have two possibilities…
Scenario 1 (black line) - chance: 75%
WTI has built two strong 1-2 elliott-wave-setups (blue in brackets and brown-beige): the blue box in the chart above is the buying zone for the rise to 80$ in the first step (end of wave 3, blue in brackets) and later on even 90$. I think we have a good chance, that WTI will rise up now (again).
BUT: be careful, because wave ii (brown-beige) has space on the downside to around 64.41$ technically. It is possible that wave ii is straining our nerves! So, keep an eye on this.
Scenario 2 (red line) - chance: 35%
WTI is falling under 64.40$ and later 63.57$. If so, we will see a sell-off to around 62$/57$, and then we have to adapt the wave count that way shown in the chart below.
The alternative wave count:
The high at 72.88$ was a 3, but one wave degree higher (purple in brackets alt.(3)). If so, we are in an A-B-C (cyan) corrective pattern to complete wave C (cyan) of 4 (purple in brackets). Please keep this in mind when placing an order.
Take care,
tgo


Cobalt mining stock set for entry off weak volumeTSX: LUN LUN
NYSE:LUNMF LUNMF
Lundin Mining is a mid-cap mining company that will benefit from rising cobalt prices and demand.
Waiting for bounce off likely 4.55 for entry, or 4.35-4.40 range, and not likely lower $4.06-4.10
Fib retracement. RSI going above 50 with 1w chart shows good entry with lots of scribble correlation.
Sorry for the business, I mean busyness here.
Cobalt value is strong and demand for electric batteries also very strong. Recovery as major player
in this area is prominent.
For own use. Put to use idea, comment or like, but review on Friday Sept. 14th.
longbuylongsell chart with blue-black courtesy of @MarxBabu.

IVPAF - Ivanhoe MinesSmall cap Mining Stock to own when VIX jumps 5% like yesterday. Entry 1.79
Development and recovery of precious and EV specialty metals: Nickel, Copper, Gold, Palladium, Zinc, Germanium, and Rhodium.

Dollar index DXY in a pressure areaDXY just entered a pressure area:
- 91.80 was a support in first week of January then it was broken: now it can be a resistance level!
- 92.25 to 92.57 was a strong resistance in January so it could be a strong resistance level too.
Slowstochastic is Overbougth, which is a good confirmation for short.
Entry SHORT level: 91.50-91.25 with a confirmation at lower timeframes
OR
Entry SHORT level: 92.64-92.32 (using a sort of QUASIMODO, look at bull candles of Jan 8th and 9th) with a confirmation at lower timeframes

BTC/USDT 4h - ShortThis looks like a decent area to short BTC or move into USDT. Don't forget to set that SL and good luck!

BTC/USDT 4h - Current Support/Resistance:Lets see if BTC can hold this support, and hopefully make a new level. Don't forget to set that stop loss!

NZDJPY LONG!!Waiting for the market open to see how price reacts and if the double bottom formation holds true for a buy trade. Possible order to buy at blue level if price slowly move there. Keeping an eye out.
Happy Trading :)
StellarKK

APHQF - APHRIA turning up TSX: APH
OTC: APHQF
Aphria stock breaking out of cup and handle for entry and weed growth as CGC, CRON, and other same sector are up 30% this week.
Entry in low $9.30-9.40 range. Been a busy week and missed ideal entry.

USDJPY Bullish Setup Today, we see a setup on the weekly and monthly price levels! A bullish engulfing candlestick pattern is obvious on the strong levels and exactly after the trendline retest!

Short squeeze scenario - XBTUSD - BITMEXPossible short squeeze targets for XBTUSD. This is what I think targets would be IF we played the ping-pong game and went to the next target on the list in the 6700s it would fulfill the "short squeeze" This is just chart art, never take these as financial advice. Have fun, Good luck.

EURUSD Weakness - Short Position Long TermEURUSD Weekly Chart - Medium to Long Term Bearish Outlook
EURUSD is at a 13 month low. It is currently resting at the 50% fibonacci level. Analysis points out that a trend reversal at this stage is not likelyTh and continued declines at or below the 61.8% fibonacci level are expected. However, a short term blip at the current 50% level may occur before continuing the downward trend.
The downward trend is expected to continue as the RSI has broken the key support line since previous 13 month low. The RSI looks to continue to fall to the 30 line. The Momentum indicator also highlights the support line which is a crucial test for the pair. If the currency pair breaks through the support line, it is likely that a test of the 100% fib line will occur.
Also interesting but not incredibly helpful, is that the pair has outlined a head and shoulders pattern, indicating that decline is likely foreseeable but doesn't provide much guidance to where it will land.
At this stage, conservative analysis points to a decline at the 61.8% fib level. This represents around a 240 pip/point profit trade with the take profit just before the 61.8% line. If the pair breaks the 61.8% line, expect a complete re-tracement.
This position is a medium to long term position with a time range between 3 to 9 months.

GBPUSD 4H NEWS SETUP TRADEFriday morning is some heavy GBP news
Long trade
Buy stop @ 1.2920
Buy Take Profit @ 1.2970
You determine SL
Short trade
Sell Stop @ 1.2840
Sell Take Profit @ 1.2790
You determine SL

USDCAD 4H SHORT TRADESPrice held at 100 sma
Short trades
1st Sell Stop @ 1.3067
2nd Sell Stop @ 1.3017
3rd Sell Stop 2 1.2947
Take Profit along the way or
Finale Take Profit @ 1.2910
SL shown - move SL as price continues to fall to protect profits

ADA/BTC 4h - EntryHere is my entry for ADA/BTC. The risk to reward is decent, the only thing to watch out for is BTC losing support at the 7200. Make sure those SL are in place, and good luck!

VET/BTC 1h - Entry ZoneHere is my entry for VET/BTC. My entry might be a bit low, buying in around 260 should be fine, just remember to set those stops. Good Luck!

USDCAD 30M SHORT TRADESPossible Bearish Short trade
Price below both ma's
1st Sell Stop @ 1.2995
2nd Sell Stop @ 1.2965
Sell Take Profit @ 1.2905
Pick your own SL
Watch Macd for direction
