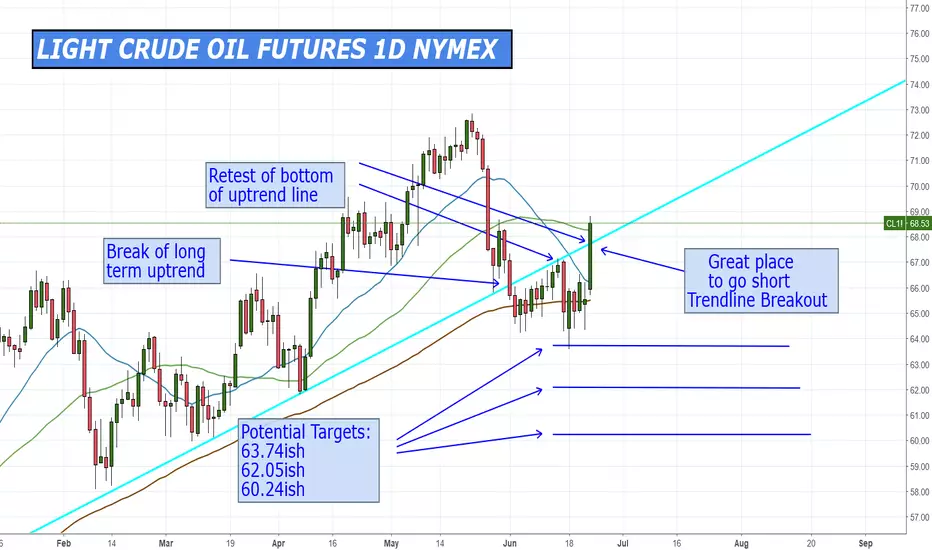
Crude is retesting the broken up trend lineCrude broke a year long up trend line earlier this month. It has now tested the bottom of the up trend line several times and looks ripe for drop.
Take your loss on a daily candle close back above the trend line .
Target the three indicated levels. You can even hold a portion of the trade for the June 2017 low.
Follow your stops as the trade moves in your direction.
Be sure to size your trade according to your risk parameters. NEVER BET THE FARM!
No trade is guaranteed 100% to work. You NEVER know what the market will do.
Your first job is to protect your trading account.
Entrypoint
ADAUSD 1h CARDANO STRATEGYStep #1: Cardano ADA price needs to trade BELOW the 200-day moving average
The first condition that Cardano requires to satisfy is to trade BELOW the 200-day moving average.
When price trades BELOW the 200-day moving average we know we have a strong premise for a bearish trend to be put in place.
The more time Cardano price spends below the 200-day moving average and the biggest the distance between the Ada price and the 200-day moving average the stronger the trend is.
Step #2: Volume needs to be above average and twice as much volume compared with previous volume bars needs to come in
We need to look for instances when the volume bars are above the average volume (the red moving average). But this is not all; we also need the buying volume to be twice as much as previous volume bars.
Wait for trading situations where the selling volume is increasing considerably. This really shows institutional buying that has the power to move the Ada coin price.
Step #3: After volume has increased, sell at the opening of the next candle
When to sell Cardano ADA is quite intuitive if you have followed this cryptocurrency step-by-step guide.
The moment we see institutional selling presence we want to be sure we’re not left out. In this regard, after the volume has increased, we sell at the opening of the next candle preceding the big volume candle.
Usually, you’ll be selling right after the first bearish candle that often is the starting point of a new trend. Don’t be afraid to sell on the way down as this will pay handsomely in the long run.
Step #4: Place protective Stop Loss above the 200-day moving average
Hide your protective stop loss above the 200-day moving average.
A market that has a strong bearish trend should not drop above the most powerful moving average aka the 200-day moving average. By hiding your stop loss above the 200 moving average, we’re minimizing risk as much as possible.
Note* as the trend progresses you can also trail your stop loss below the 200-day MA.
Step #5: You decide or Take Profit when we break and close above the 200-day Moving Average
The 200-day moving average can serve us as a significant trigger for our exit strategy.
When we break above the 200 moving average, that’s the first sign that the trend is about to change the tide. When these happen make sure you take profits.
Note** the above was an example of a SELL trade using the Cardano trading strategy. Use the same rules for a BUY trade – but in reverse.
PM me if you want to read the complete strategy

USDJPY 15M DONCHIAN CHANNEL STRATEGYStep #1: Attach the Donchian channel indicator to your chart. Preferred setting 20 periods.
For the purpose of this example, we’re going to plot the Donchian channel on the 15-minute time frame. The preferred Donchian channel settings is 20-periods, which means that the channel lines will be calculated based on the price action from the last 5 hour candles
Note* The Donchian indicator is a free pre-build technical indicator that comes free with most trading platforms.
Step #2: Wait until the price crawls along the upper Donchian Channel. The price should not go below the middle band during this stage.
It’s quite easy to visualize the Crawling Along pattern. When the price action touches the upper Donchian channel, and it stays glued to the upper line, we create the price effect where the price looks like it’s crawling along the top Donchian line.
If you think in terms of supply and demand, when the price is crawling along the upper Donchian channel, without departing too far away it means there are lots of buyers that try to push the price higher. This eventually will lead to seller capitulating once the breakout happens.
Another characteristic of the Crawling pattern is that during this stage, the price shouldn’t go below the middle Donchian band.
Note* The closer the price action moves along the upper band, the stronger the trend is.
If you spot this type of price action, then you know this day trend has a big potential for following through.
Step #3: Buy1 when the price pulls back to the middle Donchian band. Buy2 when the price pulls back to the lower Donchian band.
The channel width gives us a measurement of the market volatility. When we have high volatility in the market, this will be shown on the chart by wide channel bands, whereas low volatility will be displayed on the chart by a narrow channel.
Like with all technical indicators the Donchian channel can be subject to false signals from whipsaws and sizeable market swings. Breakouts are very hard to trade, and that is the reason why we prefer to enter on pullbacks.
We recommend splitting your trade into two parts as this will give you a better average entry price.
The first buy order is deployed when the price pulls back to the middle Donchian band, while the second buy order is deployed when the price retraces all the way to the lower Donchian band.
Our entry strategy will give us the opportunity to implement a proper risk management
This entry strategy is a good way of framing a trade. So, you have a very specific entry point
By sticking to this entry rules, you will realize this is not a bad trade to take because you trade in the direction of the prevailing trend
Step #4: Hide your protective Stop Loss below the lower Donchian band
Your stop loss can be placed below the lower Donchian band. The catch is that you need to move to the left side of the chart and find the first part of the lower Donchian band where it is flat.
You’ll find that often times the Donchian channel will plot perfectly flat lines. This can provide us with excellent spots to hide our stop loss.
Step #5: Take profit at the end of the day or if you want to ride the trend more take profit when
The beauty of the Donchian trading strategy is that you can apply multiple exit strategies so you can maximize your profits.
Now, that we know that the supply and demand balance is skewed to the upside, we can expect buyers to step in far quicker on retracements than they have before. This can indicate that we’ll have a buy explosion to the upside.
The first proposed exit strategy is to liquidate your position at the end of the day. Since we’re trying to take advantage only of the intraday trends we don’t want to have any overnight exposure.
Secondly, you can wait until the price breaks below the most recent flat lower Donchian band.
Note** the above was an example of a BUY trade using our Donchian Channel Strategy PDF. Use the same rules for a SELL trade – but in reverse.

DOGEUSD DAY STRATEGYStep #1: Wait until you can spot a bar that has its daily range smaller than the previous three days
The first rule requires you to have the patience until the Nr4 pattern develops on the Dogecoin chart. When we have a daily trading range that is narrowed than the previous trading ranges it means that the price is contracting.
Based on our backtesting results we have found out that there is a high probability of a trend move after you spot this type of contraction. This is kind of a general rule because the markets do move from periods of contractions to periods of expansion.
This is the reason why this short-term price pattern is so powerful.
Step #2: Mark the High and the Low of the 4th day and switch to the 1 hour time frame
Our trade is taken the next day after the Nr4 pattern showed up. In order to have a clear view of the short-term price action we need to switch our focus to the 1 hour time frame. Before you switch the time frames make sure you mark on your chart the high and the low of the 4th day.
Step #3: How to buy Dogecoin: Buy only if the breakout of the Nr4 high happens during the first 5 trading hours.
We use the Opening Range Breakout technique to time the market and have an effective trade entry. The ORB is even more profitable if it occurs after inside days that have a smaller trading range than the previous 3 days.
Our Dogecoin trade doesn’t have an inside day, but nevertheless we want to buy only after we break above the Nr4 day high. Also, we want to make sure the breakout happens during the first five trading hours of the next day.
Trades based on the ORB – Nr4 pattern will show you a profit instantly.
Now, if the trade is not showing you a profit right away than your trade becomes more vulnerable. As a general rule, if after the first trading hour your trade is not in the green, you can safely close the trade at the market.
Of course, you can only do that if your stop loss hasn’t been triggered in the meantime.
Step #4: Place your protective Stop Loss below the Nr4 day low
You can hide your protective stop loss below the Nr4 day low. Alternatively, you can also place your stop loss below the current day low as this will give you a better risk to reward ratio.
The ORB – Nr4 pattern tends to precede strong trend day activity, so your stop loss should be rarely hit. Both of these patterns can be traded individually, but when combined they tend to produce even more powerful trades.
Step #5: Take profit at the close of the first 1-hour bearish candle
Our take profit strategy is fairly easy and it’s slightly modified from the original strategy highlighted in the “Day Trading with Short Term Price Patterns and Opening Range Breakout” book written by Toby Crabel.
Even though the ORB pattern tends to lead to trend trading days we’re more conservative and want to quickly take profits. So as soon as the first bearish candle shows up we close the trade and enjoy our daytrade profits.
Alternatively, you can keep the trade open until the end of the day if you want to extrapolate more profits from the cryptocurrency market.
Note** the above was an example of a BUY trade using our Dogecoin cryptocurrency strategy. Use the same rules for a SELL trade – but in reverse.
PM me if you want to read the complete strategy.

NEM XEM RSI CRYPTO STRATEGYRate of Change indicator or simply put it the ROC indicator is another momentum indicator and as the name suggests it measures the rate of a crypto’s change in price and predicts future price movements.
Our RSI is applied over the ROC. So the RSI line is derived from ROC not the price.
Step 1 - Step #1: Wait until the RSI has a value of less than 30
At this stage, we need to use the RSI readings from the daily chart. Just wait until the RSI has a value of less than 30. You’ll have to wait for the daily close to get the RSI reading.
Obviously, this means that you’ll always buy XEM the next day.
Once you spot an RSI reading less than 30 we switch to a lower time frame which brings us to the second rule of the Nem (XEM) cryptocurrency strategy.
Step #2: Switch to the 1-hour chart and wait again until the RSI shows a reading of less than 30.
The second rule that needs to be satisfied before pulling our trigger is to wait again for the RSI indicator to show a reading of less than 30 but this time on the 1-hour time frame.
Remember, this should be the next day after the RSI posted less than 30 readings on the daily chart.
Step #3: How to buy XEM: Buy at the opening of the next candle after the RSI went below 30 levels.
The original momentum Pinball pattern uses a different entry method. We have done some backtesting and found that we can achieve superior returns if we follow a different entry strategy.
How to buy XEM with our cryptocurrency trading strategy is much more eloquent because it uses the concept of multiple time frame analysis.
Buy at the opening of the next candle after the RSI posted a reading of less than 30.
Step #4: Place your protective Stop Loss below the previous day low
After the buy EOS order is triggered, we need to have a strategy to protect our bottom line.
The best Nem XEM price to hide your protective stop loss is below the previous day low. The Nem XEM price should not come to this point.
Step #5: Take profit should be 2 or 3 times larger than your stop loss
Again, our exit strategy is slightly different than the original momentum Pinball pattern.
Be sure to close your Nem trade once the take profit is two or three times larger than your stop loss.
Alternatively, you can use the initial exit strategy which requires taking profits when we break above the previous day high. Don’t limit yourself to either of these two strategies, but instead make the best out of them and use the one that suits the most the current trading environment.
Note** the above was an example of a BUY trade using our Nem (XEM) cryptocurrency strategy. Use the same rules for a SELL trade – but in reverse.
PM me if you want to read the complete strategy.

Big 3 Indicator Short TradeBig 3 Indicator shows a red/yellow/green back ground to tell you training bias direction.
15m show entry point
1H shows a support level take profit
PM me if you want to read the complete Big 3 Indicator Strategy.

DASH SPIKE & LEDGE REVERSAL CRYPTO STRATEGYStep #1: Dash cryptocurrency price needs to show a steady rise that suddenly accelerates to the upside.
When this reversal pattern is complete, it will resemble a cup with a sharp bottom.
This sharp acceleration usually is the last stage of a bull cryptocurrency market, and it’s followed by a sharp reversal if all the trading criteria for a valid Spike and Ledge are met.
In technical analysis, professional traders also refer to this last spike as being an exhaustion reversal bar that has a high probability of signaling a reversal in the Dash price.
Now, before we can trade successfully, we need to understand that this key climax reversal bar needs to follow specific trading rules.
More specifically, this exhaustion reversal bar needs to follow three rules, which we’re going to highlight next.
Step #2: The exhaustion reversal bar needs to be bigger than the previous bar
Relatively speaking the exhaustion bar, which should be the last bar within the downtrend, needs to be bigger than the previous bars. However, this is not mandatory.
Ideally, the bigger the climax bar is in comparison with the other bars within the bullish trend, the more profitable the reversal pattern becomes.
Step #3: The climax bar needs to develop at a key sup/res level or after breaking a key swing low/high
We can’t stress enough the importance of location in trading.
Many times you’ll notice that a chart pattern will fail, but that’s not because that price pattern has stopped working. It’s often the case that you don’t have the patience for these patterns to develop at the right location.
In order for the Dash cryptocurrency trading strategy to work we need to wait for the exhaustion bar to show up at the right location.
Step #4: The exhaustion bar develops after several bullish impulsive bars
We need to make sure that the exhaustion bar occurs after several bullish impulsive bars.
These impulsive bullish bars will make the appearance of a bullish trend that will trap many sellers once the tide turns. And that’s how retail traders trade the markets, but to trade profitably, you need to trade against the retail mindset.
Step #5: After the upward spike, wait for the market to enter into a short period of consolidation or channeling.
Usually, after the Dash cryptocurrency price had that last spike up the market will take a pause to digest the recent move, and it will start moving into a short period of consolidation or channeling.
Simply, draw two parallel lines to contain this price range.
Now, this is what we refer to as being the “Ledge.”
The Spike and Ledge reversal pattern satisfies all trading conditions outlined above which mean that we can move forward and describe how to sell Dash coin.
Step #6: Sell Dash coin when we break below the Ledge
A short trade is entered on the breakout of the Ledge.
This is an easy entry method, but in order to avoid the short-term noise and the usual false breakouts, we need also to wait for the breakout candle to close below the Ledge.
Step #7: Place your protective Stop Loss above the Exhaustion bar
The initial protective stop loss is placed on the other side of the reversal pattern.
You hide your stop loss above the exhaustion bar.
Step #8: Your Take Profit needs to be two or three times bigger than your risk aka your stop loss.
As a general rule, you do want your take profit to be bigger than your stop loss. This is very important to your long-term survival in this business.
However, you can achieve your profit target goals by using your preferred strategy when it comes to exit the market. We encourage you to experiment different exit strategies and see which one yields better results.
Note** the above was an example of a SELL trade using our favorite Dash strategy. Use the same rules for a BUY trade – but in reverse.
PM me if you want to read the complete strategy

USDCAD 4H HEIKEN ASHI REVERSAL STRATEGYIn Japanese, Heiken Ashi means “Average Bar” and it represents the average-pace of prices.
The Heiken Ashi candlestick chart can help you to spot both trading periods and ranging periods that you should avoid.
There are two primary trade signals that we can identify through the Heiken Ashi candlestick:
1- Bullish candlesticks with no wicks or very small wicks indicate a strong uptrend and excellent buying opportunities.
2- Small candlestick characterized by a small body and big upper and lower wicks signal a potential reversal.
Use strategy on all markets and time frames.
Step #1: Identify a strong move to the upside.
One of the simple ways that we can use the Heiken Ashi candlesticks is to trade reversal when the candles changed color.
So, the first thing we’re going to look for a bullish trend or a strong move to the upside.
Note* The Heiken Ashi chart tends to give much more extended and smoother runs of bullish and bearish price candles which is because of how the calculation is used to average out the range of the bar.
Step #2: Wait for the Heiken Ashi bar to change color from bullish (green) to bearish (red)
The first sign that the price is about to turn lower is when we see a red Heiken Ashi candle.
In order for the Heiken Ashi bars to change color, there must to be a strong shift in the order flow and this typically translates into a much more reliable signal than we get when typical price candle change color on a normal price chart.
The way we look to use this feature is simply to implement traditional technical analysis to locate potential reversal zones with the Heiken Ashi chart.
We use the price action reading skills as a filter to identify a potential trade and then we use the Heiken Ashi chart as the confirmation to go ahead and execute the trade.
Step #3: The first bearish Heiken Ashi candle needs to have a bigger than average lower wick
Long lower wicks can provide an incredible trading signal, especially when using the Heiken Ashi price chart.
You can also wait until you see a bearish Heiken Ashi candle with no upper wick. However, this second approach will cost you some profits left on the table.
The Heiken Ashi trading strategy satisfies all the trading conditions, which mean that we can move forward and outline what the trigger condition for our entry strategy.
Step #4: Sell at the market at the opening of the next Heiken Ashi candle
Our entry method is very simple.
This is a bullish reversal setup, so we’re looking for buying opportunities once everything is in the right place.
Now we can anticipate that a reversal is put in place, and we can go ahead and buy EUR/USD at the opening of the next Heiken Ashi candle.
Step #5: Hide your protective Stop Loss above the first bearish candle high.
One of the really fantastic things about Heiken Ashi candles and what makes them so great for trading is how we can use them to place our protective stop loss.
Because of the tendency of the candles to display continuation, we can go ahead and be really tight with our stops. We can simply place our stop loss above the signal candle high.
Step #6: Take profit after we get a close above a previous bearish candle.
A good Heiken Ashi trade setup will tend to run for much longer than a usual price action setup. So, when we’re trading with Heiken Ashi candles, we really want to exploit this and keep our trades open for longer than we usually would.
Because we’re using such a tight stop loss, we’re only going to need a small price movement to make a good profit on this trade.
Note** the above was an example of a SELL trade using our Heiken Ashi trading system PDF. Use the same rules for a BUY trade – but in reverse.
PM me if you want to read the complete strategy.

ETHUSD 4H CCI SHORT TRADEStep #1: Wait until the CCI indicator crosses below -100 level
When we get a CCI reading below the -100 level, that shows statistically the USD gained more strength than average and therefore great for selling opportunities.
As a leading indicator, the Commodity Channel indicator can provide us with excellent great trade signals.
When the CCI crosses for the first time below the -100 level that’s the signal that a new bearish trend is about to start or at least a rally will emerge from where you can extract sound profits.
Step #2: Wait for a retracement and make sure that during that retracement the CCI indicator holds below the zero line.
Waiting for a pullback in price is a more defensive trading approach. However, you can also sell right away when the CCI crosses below -100. In this case, you need to make sure enough time has elapsed between now and the last time the CCI passed below -100.
We’re going to apply the more conservative approach and wait for a retracement and the CCI indicator to hold below the zero line during this retracement.
We want to see a weak retrace in the CCI indicator that barely goes above the -100 level, but at the same time, we need to look at the price action retracing more than the CCI did.
We want to have strength to the downside, if we’re going to sell ETH/USD we want to see continued strength in the CCI reading when the price is pulling back.
When the retracement happens, it’s important for the CCI indicator to remain below the zero line. If the CCI crosses above the zero line during the retracement, we’re no longer interested in going short ETH/USD.
This is one perfect example of how to filter bad trades from the right trades.
Note* The less the CCI turns up, the more powerful the rally should be.
Step #3: Sell after 3 or 5 candles “worth” of retracement. Or, sharp Corrections are sold at the closing price.
Now, we’re looking for short trades.
We have two options for our entry strategy.
We either sell after we have seen the market pulling back over the last 3-5 candles or we sell straight away if we have sharp corrections.
The natural ebb and flow of the market are given by these short-term pullbacks that we’re going to use to trigger our entry.
If the retrace was weak, it means the dominant energy of the market remains. The CCI indicator strategy reflects quite well what is happening behind the scene where the actual buying and selling pressure takes place.
Step #4: Place your protective Stop Loss below the most recent swing low
We’re proposing a very easy strategy to manage your stop loss. Simply place your protective stop loss below the most recent swing low.
However, it’s important to also watch the CCI indicator for further clues of weakness, and if the CCI crosses above the +100 level after you’ve entered the market, you can close the trade at the market price if your stop loss wasn’t triggered in the process.
Step #5: Take profit if CCI touches -200 or if CCI drops above the zero level. Whichever happens first.
We have two trading tactics to implement when dealing with exits.
The more profitable exit strategy is to take profits when the CCI touches the +200 level. However, since the market will only occasionally give us such big trading opportunities we need to have a backup plan.
So….
As soon as the CCI indicator turns below the zero level, we want to exit our trade. The first sign that the rally is running out of steam is when the CCI indicator crosses below the zero line.
I have also shown here 2 other options of taking profit. One is risk reward ratio (1to1, 2to1, 3to1). The second is a fib extension take profit. This trade hit the 227.2% fib.
Note** the above was an example of a SELL trade using our CCI trading strategy PDF. Use the same rules for a BUY trade – but in reverse.
PM me if you want to read the complete CCI trading strategy. Some intro information is on the update below.

ETHEREUM CLASSIC CRYPTO REVERSAL STRATEGYStep #1: Identify a clear trading range zone followed by a breakout above the resistance level.
The principal idea behind the Fakeout – Shakeout reversal pattern is that we’re looking for an area of consolidation or range trading followed by a false breakout that is QUICKLY sold by the institutional money.
A trading range is defined by price moving back and forth between clear support and resistance levels.
A valid Fakeout only needs enough bullish momentum so we can break above the trading range.
Step #2: Identify the starting point of the Fakeout movement.
What we’re looking to do next is to just wait for the buy off to fail.
The way we’re going to know that this is a false breakout is if the market starts recovering and breaking below the starting point of the buy-off.
Simply, mark on the Ethereum Classic chart the bullish candle that started the buy off. It doesn’t necessarily have to be the first bullish candle. What we look for is for the most prominent bullish candle within the upward movement.
The critical thing to watch is for the Ethereum Classic price to recover fast and not spend too much time on the upside.
Note* The stronger and faster the recovery happens, the stronger the reversal pattern becomes.
A legitimate breakout should not retrace so deep. If it does, according to our amazing reversal pattern, it signals that this was a false breakout and a bull trap.
The Fakeout – Shakeout reversal pattern satisfies both of our trading conditions which mean that we can move forward and outline what the trigger condition for our Ethereum classic cryptocurrency strategy.
Step #3: Place a sell stop order below the candle’s high identified at Step #2
The best entry technique to use when purchasing Ethereum Classic is to closely monitor the charts right when the expected reversal is occurring. You must focus first on identifying the starting point of the fakeout movement.
The fakeout movement is designed to fool traders into believing the market will go up when the real intention of the smart money is to really move the market down.
This type of fakeouts happens all the time in any market and on all time frames.
This entry strategy has only a very small window of opportunity, so you want to make sure you’re ready to pull the trigger when the trade signals show up.
We refer to this recovery as the Shakeout phase. The buyers who got caught on the wrong foot and got tricked are about to be taken out, which in turn will fuel more the downside.
Step #4: Place your protective Stop Loss above the “Fakeout high”
You also need to concentrate on seeing the logical places where to hide your protective stop loss.
Trading without a stop loss is a receipt for disaster, so always use an SL.
The initial stop loss is placed at the swing high developed during the Fakeout – Shakeout phase.
Step #5: Take Profits when the bearish momentum fades away
The easiest way to take profits is to wait until the rally starts losing the bearish momentum.
The simplest way to gauge when the bearish momentum fades away, is when the price either starts to consolidate again or when big bold bullish candle start to develop on the Ethereum Classic chart.
Alternatively, you can trail your stop loss and enjoy the opportunity to potentially make bigger cryptocurrency profits. You have to monitor new swing high points as they are formed and then just trail your protective stop loss above these swing points.
Note** the above was an example of a SELL trade using the Ethereum Classic beginner’s guide. Use the same rules for a BUY trade – but in reverse.
PM me if you want to read the complete strategy.

WFC returning from down-underShould have spotted this one sooner, 53 would have been a great entry point. Now it's getting riskier to enter. 56.15 would be another resistance level for this one, if it surpasses it then clear gainz should occur up to 58.

BTC: One Falling Wedge Already Broken to the UpsideBTC has already broken up out of one falling wedge and is looking to test the top of the bigger one everyone has been posting about.
Price found support on a 10-month-old trendline going back to July 2017, and after breaking up out of the first wedge came back to test the top of it before heading higher. The MACD on multiple timeframes is crossing up and the RSI on higher timeframes is showing bullish divergence. This coupled with the fact that dumps have been getting shorter and shorter points to a potential bullish reversal soon.


How 2 Maximize the Profit & Minimize the Loss Using ElliotwavesThis is based on the Bitcoin Market Cycle 2017 - 2018. Please note that this for Uptrend Market and it's totally Opposite for Downtrend Market if you are able to Short.
Also note that you can apply the same for any Market not just for Bitcoin.
- In a Uptrend We have 5 Waves followed by 3 Corrective Waves
- In that 5 Waves 1,3 & 5 are Impulsive Waves Going up and 2 & 4 Corrective Waves going down.
- We only buy in the beginning of the above waves 1,3 & 5 and sell in the top of those waves
- Wave (1) (2) (3) (4) (5) are Intermediate Waves
- Wave 1 2 3 4 5 are Minor Waves which is Sub waves of each (1) (2) (3) (4) (5)
- Wave (1) price movement can take upto ~2months or more
- Wave (3) price movement can take upto ~4months or more
- Wave (5) price movement can take upto ~3months or more
- Use Daily Chart see the big picture and 4hr to check and confirm the Waves (1) (2) (3) (4) (5)
Now lets assume that you are going to invest 1000$
You can adjust this to match your investment amount
Start of the Uptrend is Point 0 and End of Uptrend is Point T
To find the Entry Point or Point 0 we need to find a new market cycle by doing the following in Daily Chart & 4hr Chart to confirm the trend change
-Using Wave 5 channelling technique of the previous market cycle
-Reversal chart patterns (wedges, double/triple bottoms, broken trendlines etc)
stockcharts.com
-8,13,21, and 34 day Fibanacci Ema filter
investorji.in
After finding the Entry Point 0 then its time to find the Targets for Buy, Sell and Stop Loss
Entry Points (Buying Targets)-
Wave (1): Buy 300$ @ Wave 1 of Wave (1) Retrace 50% to Wave 2
Wave (3): Entry 1: Buy 500$ @ Wave (1) Retrace 50% to Wave (2)
Entry 2: Buy 400$ @ Wave 2 of Wave (3) pass Wave 1 level going up.
Wave (5): Buy 200$ @ Wave (4) Retrace 38.6% of Wave (3)
See the highlighted boxes for the 4 Entry Points
Stop Loss (Protecting Investment)-
Wave (1): Sell all if the Price goes below Point 0. You can reverse and go Short if your exchange allow to do so.
Wave (3): Stoploss 1: Sell all if the Price moves below Point 0.
Stoploss 2: Sell all if the Price moves below Intermediate Wave (2)
Wave (5): Stoploss 1: Sell all if the Price moves below Intermediate Wave (4)
Stoploss 2: Sell all if the Minor Wave 4 moves below Minor Wave 1 of Intermediate Wave (5)
See the highlighted boxes for the 5 Stop loss Points
Exit Points (Selling Targets)-
Wave (1): Sell 200$ @ End of Wave (1). Do 2.618 Fibonacci Extension of Wave 1 of Wave (1) to find end of Wave (1)
Project Wave (3) with 3.618 - 4.618 of Wave (1)
Wave (3): Sell 700$ @ End of Wave (3). Do 3.618 - 4.618 Fibonacci Extension of Wave 1 of Wave (3) to find end of Wave (3)
If Wave (3) is extended then End of Wave (3) is closer to 4.618
Wave (5): Sell 500$ @ End of Wave (5). Do 1.618 - 2.618 Fibonacci Extension of Wave 1 of Wave (5) to find end of Wave (5)
If Wave (3) is extended then End of Wave (5) is closer to 1.618
See the highlighted boxes for the 3 Exit Points
Ideas & Comments are welcome to make this Idea much better. Thanks
RISK DISCLOSURE:
Please note that this is purely Educational purposes only and not as Individual Investment Advice. If you choose to follow the above techniques you do so at your own risk after giving thorough and reasonable thought and consideration to your actions and their potential consequences

BEST ICHIMOKU STRATEGY for QUICK PROFITS Step #1 Wait for the Price to Break and close above the Ichimoku Cloud
Ichimoku cloud trading requires for the price to trade above the Cloud because that’s a bullish signal and potentially the beginning of a new up-trend.
The cloud is built to highlight support and resistance levels and it’s supposed to highlight several layers deep because support and resistance are not a single line drawn in the sand, but several layers deep.
So, when we break above or below the Ichimoku Cloud that signals a deep shift in the market sentiment.
Step #2 Wait for the Crossover: The Conversion Line needs to break above the Base Line.
The price breakout above the Cloud needs to be followed by the crossover of the Conversion Line above the Base Line. Once these two conditions are fulfilled only then we can look to enter a trade.
As you can notice the Ichimoku Cloud indicator is a very complex technical indicator that can be used even as a moving average crossover strategy.
Now, we’re going to lay down a very simple entry technique for the Ichimoku Kinko Hyo trading system.
Step #3 Buy after the crossover at the opening of the next candle
Ideally, any long trades taken using the Ichimoku strategy are taken when the price is trading above the Cloud. Our team at TGS website has adopted a more conservative approach and added an extra factor of confluence before pulling the trigger on a trade.
So, after the crossover we buy at the opening of the next candle.
Step #4 Place protective stop loss below the breakout candle
The ideal location to hide our protective stop loss is below the low of the breakout candle. This trading technique accomplishes two major things.
Firstly, it’s minimizing significantly the risk of losing big money and secondly, it helps us trade with the market order flow.
Since this is a swing trading strategy we’re looking to capture as much as possible from this presumably new trend and we’ll be looking to trail our stop loss level below the Cloud or exit the position once a new crossover happens in the opposite direction.
Step #5 Take Profit when the Conversion Line crosses below the Base Line
We only need one simple condition to be satisfied for our take profit strategy.
When the conversion line crosses below the base line we want to take profits and exit our trade.
Alternatively, you can wait until the price breaks below the Cloud but this means risking to lose some parts of your profits. In order to gain more sometimes you have to be willing to lose some.
Note** the above was an example of a BUY trade using the advanced Ichimoku trading strategies. Use the same rules for a SELL trade – but in reverse. In the figure below, you can see an actual SELL trade example.

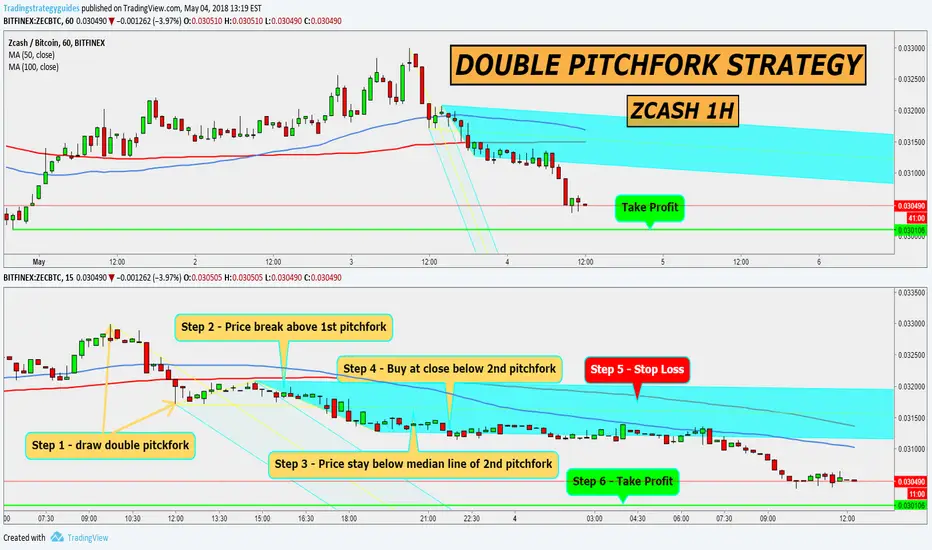
ZCASH ZECBTC 1H DOUBLE PITCHFORK STRATEGYStep #1: Draw the double Pitchfork channel
The first thing that we need to pay close attention is how we select our swing points. We only want to choose significant swings on the Zcash chart.
Once you locate the four swings, merely use the Pitchfork indicator to draw the double Pitchfork channel.
There is a simple reason why we use two Pitchfork channels.
Our team at TSG has discovered that the Pitchfork indicator has limited power in forecasting future price movements. However, by using this simple trading trick to combine two Pitchfork indicators together, we eliminate a lot of the drawbacks that come with this unique technical indicator.
Step #2: Wait for Zcash price break above the 1st Pitchfork channel
At this stage, if the two pitchfork channels overlap don’t get confused about it. The 2nd pitchfork is darker color.
Wait for the Zcash price to break above the 1st pitchfork channel. We want to see a big bold breakout candle that closes above the 1st Pitchfork channel.
Step #3: The Zcash price needs to trade below the median line (2nd pitchfork channel) on a closing basis.
The median line of the second pitchfork channel needs to hold the upside and provide us with strong resistance.
As a general rule, as long as we trade NEAR the median line, we’re good to go even if for a brief period of time we still break above the resistance line. Most of the time, the Zcash price will gravitate towards the median line back and forth, so we need to take that into consideration if we want to trade cryptocurrency strategies successfully.
Step #4: Buy at the market or stop order as soon as we break below the 2nd Pitchfork Channel bottom support line.
How to buy/sell Zcash is simple.
With our entry technique, we sell at the market or stop order when we break below the 2nd Pitchfork Channel bottom support line.
The advantage of this cryptocurrency entry strategy is that we sell when the momentum is in our favor.
Step #5: Place protective Stop Loss above the 2nd Pitchfork Channel median line
One of the most important things in trading is risk management.
So, don’t forget to place your protective stop loss in order to minimize the potential losses.
After you sold Zcash ZEC, make sure you add your stop loss order above the 2nd Pitchfork channel median line.
Step #6: Take Profit when we touch the median line of the 1st Pitchfork Channel
or according to your trading plan
Our take profit strategy for successful cryptocurrency trading is easy to implement.
We don’t want to take premature profits, but we also don’t want to give back our hard earned profits either. In this regard, we take profits when Zcash price reaches again the median line of the 1st Pitchfork channel or according to your trading plan.
Note** the above was an example of a SELL trade using the Zcash cryptocurrency trading strategy. Use the same rules for a BUY trade – but in reverse.
USDCAD 4H RANGE TRADESPair has been in a consolidation pattern above the 50 sma.
Buy stop @ 1.2918 if prices pushed for a higher high in the up trending pattern
Long Take Profit @ 1.2995
Sell Stop @ 1.2795 if price drops below the 50 sma
Sell Take Profit @ 1.2730
I will follow the Macd for a stop loss either direction.
If Macd crosses either the Red Signal Line or the Zero level line against open trade
Or a hard stop of 26 pips above/below the candle that opens your trade

GBPUSD 4H RETRACEMENT PHASE TRDEPrice in an obvious down trend
Anticipating a retracement phase
NFP is the end of the week
Probability this price action will reverse because:
Price would move to a more neutral position before Friday
Price stretched far from ma's core center
Macd stretched far from zero line
Macd over sold
Possible Fractal Bullish breakout setup developing at current price action

Adobe ADBE slowstochastic is coming up!Adobe ADBE slowstoch is coming out the 20 zone.
Title is coming from a 6 consecutive loosing days and slowstochastic crossing above 20 could be a good signal of reversing.
Stock strenght is above 63.
Watch the stock and lets see on lower timeframes if there is a entry signal (may be 212 to 212.24).
If today the stock makes a PBT&CA at 212.24 that is my entry point!
Disclaimer:
This is just my tought: don't invest based on this idea.

Match Group MTCH formed a pin barMatch group MTCH slowstoch is oversold and yesterday the stock formed a pin bar .
Slowstochastic is below 20 so oversold: pin bar could be a good signal for reversing the trend.
Stock strenght is above 85!
Watch the stock and lets see on lower timeframes if there is a entry signal (for example at 4h TF).
Disclaimer:
This is just my tought: don't invest based on this idea.

Continuation of Gann Fan Propulsion Strategy Steps 3-4-5Step #3: Apply again the Gann Fan Indicator on the Swing low Prior to the Breakout above 2/1Gann Fan Angle
How to use the Gann fan indicator? Simply follow the instruction presented in the above sections.
At this point, you can also get rid of the previous Gann fan angles drawn from the swing high. This will make sure your chart will not get cluttered and the price is still visible.
One of the reasons why this is the best Gann fan strategy is because we use the Gann fan indicator to track every swing in the market.
At this point, your trade is opened, but we still need to determine where to place our protective stop loss and take profit orders, which brings us to the next step of best Gann fan trading strategy
Step #4: Place Your Protective Stop Loss below the Most Recent Swing Low Which should align with the point from where you draw the second set of Gann Fan Angles.
The best Gann fan strategy has a very clear level where we should place our protective stop loss order which is right below the swing low located prior to the 2/1 Gann angle breakout.
Step #5: Take Profit once we Break and Close Below the 2/1 line.
We want to ride the new trend for as long as possible and with the help of the Gann fan indicator, we can pinpoint the ideal time to take profits. We take profit at the earliest symptom of market weakness which is a break below the 2/1 line that signals a possible start of a bearish move.

EURAUD SHORT TRADE NOWEntered trade at 1.6019
Take Profit @ 1.5955
Day chart price has fallen into BB Dev 1 band channel bearish bias
4H - Macd over bought/falling to 50 sma/needs to break below to 100 sma
1H - Price entered trade moving to take profit @ 1.5955

GBPUSD 4H TRADESEURUSD fell to 800 sma
GBPUSD could follow
Short Trade
Sell Stop @ 1.3867
Take Profit @ 1.3775
Long Trade
Buy Stop @ 1.4005
Take Profit @ 1.4070
