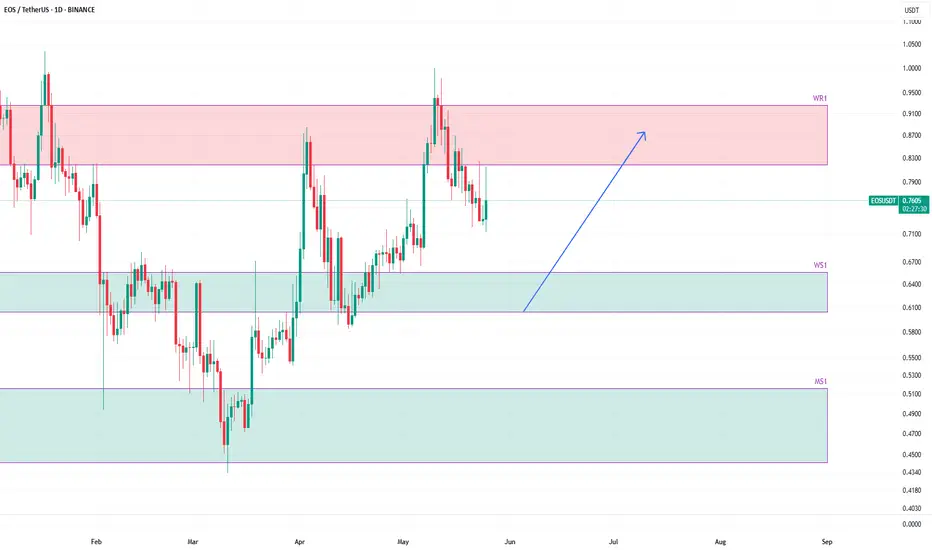
EOSUSDT to bounce from weekly support on dropEOSUSDT is currently trending down after hitting weekly resistance WR1.
The next support is weekly support WS1. This is a logical zone from where the price is likely to bounce. This bounce will have first traget as WR1.
In case the price, anytime breaks WS1 zone, the next support is monthly support MS1. This is a quite strong support area and a long from here would be a good trade since the probability that the price will hold and bounce from there will be very high.
EOS
Be careful with EOS !!!The EOS will increase 30 cents and reach to the top of the wedge in the coming weeks .
Give me some energy !!
✨We spend hours finding potential opportunities and writing useful ideas, we would be happy if you support us.
Best regards CobraVanguard.💚

EOSUSDT 1D Analysis EOS ~ 1D Analysis
#EOS Buy on retesting this support block with a short term target of at least 10%++

EOS Update: New 2025 All-Time High & MoreWe've been looking at the daily timeframe for EOS and the daily timeframe is mostly short-term. This is because we were focused on a leveraged trade setup. But, now that the bullish bias has been confirmed—notice how big is this weekly session—we can consider the bigger picture.
Here is EOSUSDT still moving within the long-term consolidation channel that appeared after the 2022 bear market. Immediately we can extract some positives out of this information, it is still early.
While EOS has been growing now for two months straight, since March 10, the action is still happening below the early December 2024 high. This high is part of a long-term consolidation channel.
As the action turns bullish and a recovery develops, EOS will finally enter the bullish zone. The bullish zone activates higher prices and these higher prices will lead to the 2025 bull run ending in a new All-Time High.
The targets are divided in two sessions, the local targets ending around $5.50 and the "global" targets which show $9.50 as a strong level, $11.8 and also $23.6 as a new All-Time High potential. This is only a potential because I haven't given much thoughts to these numbers. My strategy is to keep it clean and simple. Get the bottom—buy when prices are low—wait patiently and let the market grow.
Just as the market showed us with clear and strong signals when the bottom was in, it will also reveal when the top is in. We just buy and hold and when prices are up, we enjoy the profits and consider selling when the action is near a top. Not the perfect top, but near the top because it is hard to know how far up a Cryptocurrency can really go.
When the last wave comes, the market becomes euphoric and everything gets out of control. A rise to $23 can lead to $34, $55, $80 or even more because the last wave is the speculative phase, anything goes.
I hope you enjoy the content.
It is still early.
Thanks a lot for your continued support.
Namaste.

The key is whether it can be supported and rise near 0.8033
Hello, traders.
If you "Follow", you can always get new information quickly.
Please click "Boost" as well.
Have a nice day today.
-------------------------------------
(EOSUSDT 1D chart)
The 0.8033 point is the HA-High indicator point on the 1W chart.
The M-Signal indicator on the 1M chart is passing near this point.
Accordingly, the key is whether it can be supported and rise near 0.8033.
If the price is maintained above the M-Signal indicator on the 1M chart, it is highly likely that the upward trend will continue in the medium to long term.
-
I think the 0.8033 point is a possible point for a breakout trade.
The next possible point for a breakout trade is the 1.3193 point.
-
If it is supported and rises near 0.8033, you should respond depending on whether there is support near 1.0044-1.100.
-
If it falls from the 0.8033 point,
1st: 0.6678-0.6920
2nd: 0.5255-0.5820
You should check whether there is support near the 1st and 2nd points above.
-
Thank you for reading to the end.
I hope you have a successful trade.
--------------------------------------------------
- This is an explanation of the big picture.
I used TradingView's INDEX chart to check the entire range of BTC.
I rewrote the previous chart to update it by touching the Fibonacci ratio range of 1.902 (101875.70) ~ 2 (106275.10).
(Previous BTCUSD 12M chart)
Looking at the big picture, it seems to have been following a pattern since 2015 and has been rising.
In other words, it is a pattern that maintains a 3-year uptrend and faces a 1-year downtrend.
Accordingly, the uptrend is expected to continue until 2025.
-
(Current BTCUSD 12M chart)
Based on the currently written Fibonacci ratio, it shows up to 3.618 (178910.15).
Fibonacci ratio 0.618 (44234.54) is not expected to fall again.
(BTCUSDT 12M chart)
I think it is around 42283.58 when looking at the BTCUSDT chart.
-
I will explain it again with the BTCUSD chart.
The Fibonacci ratio ranges marked in the light green boxes, 1.902 (101875.70) ~ 2 (106275.10) and 3 (151166.97) ~ 3.14 (157451.83), are expected to be important support and resistance ranges.
In other words, it seems likely to act as a volume profile range.
Therefore, in order to break through this section upward, I think the point to watch is whether it can rise with support near the Fibonacci ratios of 1.618 (89126.41) and 2.618 (134018.28).
Therefore, the maximum rising section in 2025 is expected to be the 3 (151166.97) ~ 3.14 (157451.83) section.
To do that, we need to look at whether it can rise with support near 2.618 (134018.28).
If it falls after the bull market in 2025, we don't know how far it will fall, but considering the previous decline, we expect it to fall by about -60% to -70%.
So, if the decline starts near the Fibonacci ratio 3.14 (157451.83), it seems likely that it will fall to around Fibonacci 0.618 (44234.54).
I will explain more details when the downtrend starts.
------------------------------------------------------

EOS Update: 2025 Bull Market ConfirmedYesterday EOS produced a high volume candle, the first one since mid-April.
The conditions for this pair are really good and everything is happening according to bull market dynamics.
Notice the developing of a broad rising channel. Also notice the fact that after the major low in early March there is no rush for the market to grow, instead, we are seeing slow and steady growth. This is a type of consolidation which I call bullish consolidation, instead of sideways prices accumulate but slowly moving higher.
The other reason why there is no hurry for the market to grow is because we are now in a bull market. Since there is going to months and months of bullish action, the bulls can take their time and this is what is happening.
The path is clear and the bullish bias is 100% confirmed. It is reinforced with each passing day that closes green. Patience is key.
In late 2024 the bullish wave lasted exactly one month, between 4-November and 4-December, this time, the bullish wave can last 6 months or more from bottom to top. When the bullish wave is over the action will go off this chart.
Prepare for positive surprises.
Prepare for huge profits.
Do whatever you have to do to be prepared.
Do not be caught off guard, it will be big and the market will give you as much as you can handle.
Thanks a lot for your continued support.
Namaste.

#EOS/USDT#EOS
The price is moving within a descending channel on the 1-hour frame and is expected to continue lower.
We have a trend to stabilize below the 100 moving average once again.
We have a downtrend on the RSI indicator, supporting the upward move with a breakout.
We have a resistance area at the upper limit of the channel at 0.6118.
Entry price: 0.6046
First target: 0.5921
Second target: 0.5710
Third target: 0.5480

TradeCityPro | EOS Retraces Gains: Key Levels to Watch Now👋 Welcome to TradeCity Pro!
In this analysis, I’m going to review the EOS coin for you. This is one of the American-based projects operating in the Web3 space, currently ranked 63 on CoinMarketCap with a market cap of $970 million.
⌛️ 4-Hour Timeframe
On the 4-hour timeframe, as you can see, the price formed a bullish move after breaking through the 0.5997 level, which continued up to the 0.8604 zone before entering a correction phase.
🔍 After being rejected from the 0.8604 top, the price experienced a significant decline and has now returned to the 0.5997 level, fully retracing all of its previous bullish waves.
📈 For a long position, you can enter on a breakout above 0.6338. If the price stabilizes above this zone, it could move upward toward the 0.8064 level.
🔽 For a short position, you can enter if 0.5997 is broken, and the next bearish leg could potentially extend to 0.5433.
📝 Final Thoughts
This analysis reflects our opinions and is not financial advice.
Share your thoughts in the comments, and don’t forget to share this analysis with your friends! ❤️

eos buy midterm"🌟 Welcome to Golden Candle! 🌟
We're a team of 📈 passionate traders 📉 who love sharing our 🔍 technical analysis insights 🔎 with the TradingView community. 🌎
Our goal is to provide 💡 valuable perspectives 💡 on market trends and patterns, but 🚫 please note that our analyses are not intended as buy or sell recommendations. 🚫
Instead, they reflect our own 💭 personal attitudes and thoughts. 💭
Follow along and 📚 learn 📚 from our analyses! 📊💡"

#EOS/USDT#EOS
The price is moving within a descending channel on the 1-hour frame, adhering well to it, and is heading for a strong breakout and retest.
We are seeing a rebound from the lower boundary of the descending channel, which is support at 0.6321.
We have a downtrend on the RSI indicator that is about to be broken and retested, supporting the upward trend.
We are looking for stability above the 100 Moving Average.
Entry price: 0.6321
First target: 0.6620
Second target: 0.6931
Third target: 0.7294

Important support and resistance zone: 0.6678-0.8033
Hello, traders.
If you "Follow", you can always get new information quickly.
Please click "Boost" as well.
Have a nice day today.
-------------------------------------
(EOSUSDT 1M chart)
In order to continue the uptrend, it must rise above the M-Signal indicator on the 1M chart.
Currently, the HA-Low indicator on the 1M chart is formed at the 2.8769 point, so if the HA-Low indicator is not newly created, it will rise to around 2.8769 and show support, which is the time to buy.
However, since it is far from the M-Signal indicator of the 1M chart, it is important to check whether the price is maintained above the M-Signal indicator of the 1M chart for now.
-
(1D chart)
The 0.6678-0.8033 section is an important support and resistance section.
Therefore, the key is whether it can be supported and rise near this section.
If it falls, you should check whether it is supported near 0.5255-0.5820.
If it starts to rise, it is likely to rise to the HA-Low indicator of the 1M chart.
-
Thank you for reading to the end.
I hope you have a successful trade.
--------------------------------------------------
- This is an explanation of the big picture.
I used TradingView's INDEX chart to check the entire section of BTC.
I rewrote the previous chart to update it by touching the Fibonacci ratio range of 1.902 (101875.70) ~ 2 (106275.10).
(Previous BTCUSD 12M chart)
Looking at the big picture, it seems to have been following a pattern since 2015 and has been rising.
In other words, it is a pattern that maintains a 3-year uptrend and faces a 1-year downtrend.
Accordingly, the uptrend is expected to continue until 2025.
-
(Current BTCUSD 12M chart)
Based on the currently written Fibonacci ratio, it shows up to 3.618 (178910.15).
Fibonacci ratio 0.618 (44234.54) is not expected to fall again.
(BTCUSDT 12M chart)
I think it is around 42283.58 when looking at the BTCUSDT chart.
-
I will explain it again with the BTCUSD chart.
The Fibonacci ratio ranges marked in the light green boxes, 1.902 (101875.70) ~ 2 (106275.10) and 3 (151166.97) ~ 3.14 (157451.83), are expected to be important support and resistance ranges.
In other words, it seems likely to act as a volume profile range.
Therefore, in order to break through this section upward, I think the point to watch is whether it can rise with support near the Fibonacci ratios of 1.618 (89126.41) and 2.618 (134018.28).
Therefore, the maximum rising section in 2025 is expected to be the 3 (151166.97) ~ 3.14 (157451.83) section.
To do that, we need to look at whether it can rise with support near 2.618 (134018.28).
If it falls after the bull market in 2025, we don't know how far it will fall, but considering the previous decline, we expect it to fall by about -60% to -70%.
Therefore, if the decline starts near the Fibonacci ratio 3.14 (157451.83), it seems likely that it will fall to around Fibonacci 0.618 (44234.54).
I will explain the details again when the downtrend begins.
------------------------------------------------------

LIMIT ORDER - #EOS/USDTLIMIT ORDER - $EOS/USDT
Direction: #Short 🔴
Entry Price: 0.766
Stop Loss: 0.85406
Target 1: 0.70734
Target 2: 0.64868
Target 3: 0.59002
Target 4: 0.53137
Target 5: 0.47271

EOS price analysis⁉️ Do you know which asset has been growing instead of falling for 3 weeks now?)
Yes, it's #EOS
You will say that its price simply has nowhere to fall, and you will probably be right again!)
Although it is still very far from 0, it was once the largest ICO in 2017, if memory serves, it raised $4 billion.
8 years have passed and #EOS capitalization does not even reach $1 billion.
In general, the price of OKX:EOSUSDT moves quite well between levels, so you can use them from the chart for your trading.
Or just continue to wait patiently for the #EOSUSD price to reach $0.70, $1, or even $1.40 again.
🤑 But with even the most optimistic forecasts, we have very little faith that the price of #EOS will reach more than $6 in this growth cycle.
_____________________
Did you like our analysis? Leave a comment, like, and follow to get more

EOS Will Surprise You In This Cycle!Hello, Skyrexians!
While Bitcoin Dominance is growing and most of alts are going down as we said, we have one coin BINANCE:EOSUSDT which is going against the market. Why it's happening and how this dinosaur of the crypto world will surprise you in 2025?
Let's take a look at the weekly chart. We can see that the previous bull run was not so impulsive for this asset. Moreover price has broken the major support level and turned EOS into the "scam" category. This crypto has a lot of haters and it looks like the missile is empty and can fly. Multiple green dots on the Bullish/Bearish Reversal Bar Indicator give us a hint that this coin is very strong. Moreover, multiple divergence on Awesome Oscillator also can stop almost every trend. We are not expecting the new ATH, but exit pump to 0.61 Fibonacci zone is likely. The target is $7-9.
Best regards,
Skyrexio Team
___________________________________________________________
Please, boost this article and subscribe our page if you like analysis!

EOS Higher Low: Long Analysis With Positive Crypto-Market TalkEOS is now trading three consecutive weeks green.
Higher low after long-term bottom. Double-bottom in 2024.
Good afternoon my fellow trader.
You are the essence of the Cryptocurrency market.
The Cryptocurrency market is alive today and it exists only because of you.
Without you and me, there would be no Cryptocurrencies.
Only your support makes it possible for this innovation to continue to expand, improve and grow.
It is because of your attention and commitment that Crypto will continue to shine; Bitcoin is going up.
We are not only Crypto but we are also the financial markets and all markets.
We are reality, we are life and we are all one and the same.
Let's do this together. We can improve our lives, our environment and achieve success.
Together we can win.
Now, let's trade!
___
EOSUSDT is bullish confirmed.
One being bullish confirms the rest of the market being bullish or moving in this direction. This is only a valid statement because we know the market and how it works. We know EOS is one of the solid projects and we know its patterns and cycles. It tends to move with the rest and this time around it will be strong.
Let's look closer. This week is new but it is green. New and green is good; 100% positive.
The week that produced the higher low, 10-March 2025, is a classic Doji (reversal signal). This reversal is confirmed with the action we are seeing now.
Three weeks green after a long-term higher low means that we are now, already, within the bull-market period. This is the start of long-term growth. Prices are still low. Very low.
EOS will grow really wild. It will go really high. Prices will end up being really strong in 2025. 14X higher or more. You can always use the 'Filter ideas' feature in my profile to find other publications for this and other pairs with the 2025 All-Time High. Type EOSUSDT after tapping on my username and you will see what I mean. This will produce a list of results.
EOSUSDT has been sideways since August 2023. Or June 2023 based on a price average in-between the high and low of the sideways period between that date and present day. We are talking about some 666 days. This is really good. This is a very strong consolidation phase. This confirms and supports what is coming next.
Overall, marketwide. Real Altcoins market. Everything is looking good. The bottom is in and has been in for a long while now and we are getting ready for growth. We are still within the sideways period, but this phase won't be valid and active for long. Notice how we have three green weeks on EOSUSDT. The market will not move straight up but this is the beginning of a new bullish wave.
It tends to fluctuate. This is normal and expected. We have no complaints.
All is good that ends well. All is perfect when the market is set to grow.
Great entry timing is possible now, all across. Buy and hold.
Remember, you can leave a comment with your request for any Altcoins you want me to look at. I will consider it and publish based on the chart and overall market conditions.
Thanks a lot for your continued support.
We are doing good but things will get better.
This is only the start. Wake up! It is not too late.
The 2025 bull-market is on now.
Thank you for reading.
Namaste.

Breaking: $EOS Surged 20% Today Amidst a Falling Wedge PatternBuilt and integrated in the Binance Smart chain (BSC) NYSE:EOS coin spiked 20% today amidst a falling wedge pattern with technical patterns indicating a second legged up with a 180% surge in sight.
With the RSI at 79 momentum is increasing and the bulls are striving to push this altcoin to the $1 pivot. The asset is already trading above key moving averages, and with the daily candle stick depicting a bullish Harumi pattern, a trend continuation might be imminent. However, there might be short term correction to cool off before picking liquidity up.
What Is EOS Network?
The EOS Network is an open-source blockchain platform that prioritizes high performance, flexibility, security, and developer experience. As a third-generation blockchain platform powered by the EOS virtual machine, EOS has an extensible WebAssembly engine for deterministic execution of near fee-less transactions.
EOS is the market's most scalable, divisible, and programmable digital currency. EOS is a Delegated Proof of Stake (DPoS) network where stakeholders have the authority to select node operators. EOS is fully decentralized power doesn't reside in the hands of block miners, but rather all parties involved in the EOS Network.
EOS Price Live Data
The live EOS price today is $0.832481 USD with a 24-hour trading volume of $749,481,793 USD. EOS is up 19.40% in the last 24 hours, with a live market cap of $1,295,646,252 USD. It has a circulating supply of 1,556,368,173 EOS coins and a max. supply of 2,100,000,000 EOS coins.

EOSUSDT(EOS) Updated till 02-04-25EOSUSDT(EOS) Daily timeframe range. PA trying to push toward 0.9283. which is recent resistance. it had a clean break but to keep retrace intact it need to stay above 0.6801. volume is decent here.

EOSUSD: Channel Up bottomed. Starting bullish leg to 1.500.EOS is about to turn overbought on its 1D technical outlook (RSI = 69.362, MACD = 0.013, ADX = 39.380) indicating a strong bullish momentum that shouldn't go away anytime soon as the 1W RSI is only neutral (RSI = 51.171). This is because just today it managed to cross over the 1D MA200 on a technical rebound that started at the bottom of the 1 year Channel Up. Essentially we've initiated the new bullish wave. Our estimate for the next HH and most likely Cycle peak is 1.500.
## If you like our free content follow our profile to get more daily ideas. ##
## Comments and likes are greatly appreciated. ##

Short Position EOS/USDT#Singal
EOS/USDT
🔴 Short Position
🎲 Entry @ 0.6990
✅ Target1@ 0.6664
✅ Target2 @ 0.6220
✅ Target3 @ 0.5476
✅ Target4 @ 0.4856
✅ Target5 @ 0.4263
❌ Stop Loss @ 0.8509
Leverage: 5X_15X
Margin: 10% of Wallet Balance
⚠️"Take Care of Risk Management for Your Account"

EOS (rebranding to Vaulta) - Technical & Sentiment OutlookKeeping it simple: I've outlined a clear trading channel on the chart. Following recent news about the "EOS" rebrand to "Vaulta" Banking in May 2025, it appears we've already formed a local double bottom around the $0.40 level.
The next logical short-term target is $1.20, which I expect could be reached by the end of May, provided momentum continues.
Beyond that, the long-term potential opens up significantly. I've highlighted my long-term target zone in yellow, while the bold green levels represent more speculative, optimistic scenarios—likely achievable only in the event of a broader altcoin supercycle.
My realistic long-term price target stands at $6, which I believe is entirely attainable under favorable conditions. Anything beyond that would be considered a bonus.

EOS ( SPOT - INVESTMENT )BINANCE:EOSUSDT
EOS / USDT
1D time frame
analysis tools
____________
SMC
FVG
Trend lines
Fibonacci
Support & resistance
MACD Cross
EMA Cross
______________________________________________________________
Golden Advices.
********************
* Please calculate your losses before any entry.
* Do not enter any trade you find it not suitable for you.
* No FOMO - No Rush , it is a long journey.
Useful Tags.
****************
My total posts
www.tradingview.com

EOS Breakout Alert: Massive Surge Incoming?EOS is currently shaping a falling wedge pattern, a well-known bullish reversal structure that often precedes high-volatility breakouts. The price action is tightening within this formation, pressing against strong descending resistance, while key support levels remain intact.
Bullish Breakout Levels to Watch
To confirm a bullish breakout, EOS must pierce through the descending resistance and the critical blue resistance zone at $0.6711 - $0.7097. A successful breakout could ignite a strong rally toward $0.8115, followed by a potential surge into the major green resistance zone at $1.3363 - $1.4329. However, without a decisive move above resistance, EOS remains vulnerable to further consolidation or a potential fakeout.
Key Support Levels for EOS Bulls
The primary support zone sits at $0.5458, a level where buyers have historically defended against bearish pressure. If this support fails, the next critical defense lies in the yellow support zone at $0.4101 - $0.4002, marking the final stronghold for the bulls. As long as EOS holds above support, buyers retain a strategic advantage to fuel an upward push.
Will EOS break out and surge higher, or will resistance hold strong? Traders should monitor these key levels closely for the next big move!

Will EOS Peak At $10 (1,400%) or $16 (2,300%)? Click To Read!EOS is already moving and we have a strong target at $10 for a whooping 1,400%.
How are you doing today my fellow trader?
I hope you are having a wonderful start to your weekend.
EOSUSDT is in a great situation right now and timing is awesome for this pair; it is already moving.
This week is the second green week after a clear reversal signal. The reversal signal came on the 3-Feb. session with a strong hammer candlestick pattern. The hammer when coming at the bottom of a move indicates the end of such a move. The two weeks green following the signal work as confirmation. But it is still early.
The price hasn't change much but the small consolidation needed for a strong rise is almost over. We will see EOSUSDT changing from being quiet, to moving very strong. This will be a top performer this year.
There is another target beyond $10 with a potential of 2,300% from current price. This is the $15.9 level and a new All-Time High. This is a do-able target but we will have to wait and see. At this point, the most important part is a great-entry, great entry and timing.
Once the action starts we will know better how far up it can go, but there is no point in knowing if the wave starts and we haven't bought. So buy and hold. Wait patiently and the market will take care of the rest. You will need an exit strategy, when to take profits... I will be here sharing charts when are near the top just as I am doing now as we are close to the bottom.
So you can plan ahead or wait for when the time comes, I will be giving plenty of warnings and instructions, different approaches to the targets and more.
Your support is highly appreciated.
Cryptocurrency is going up.
Thank you for reading.
Namaste.
