EOS-BTC

EOS/BTC
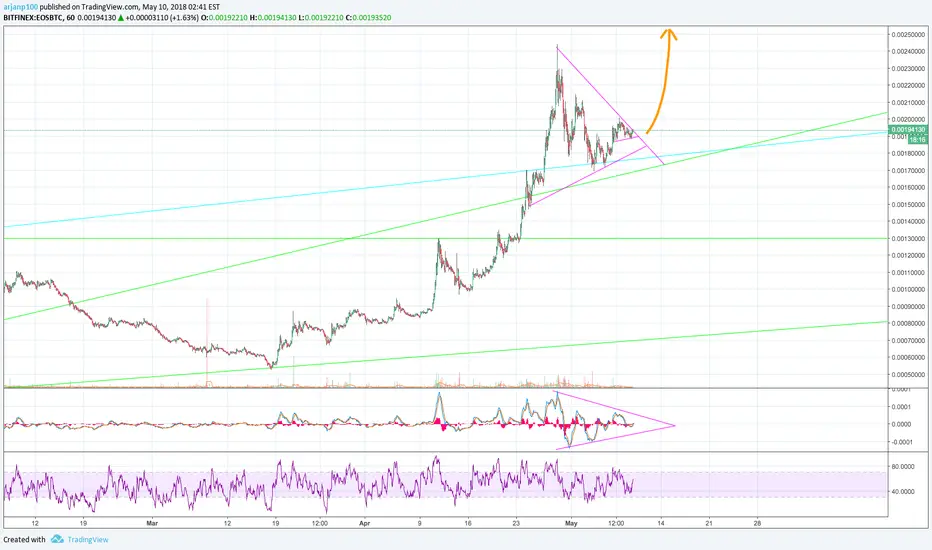
Not all too convinced with support I have drawn, but the resistance is fact as 4hr RSI fails to maintain above midpoint. Would not worry so long as we do not put in a lower low on RSI. Support upon RSI 1hr can be found as EMA comes together.

EOS, EOSBTC - A Bullish Outlook This is an updated analysis on EOS, EOSBTC.
Analyses
- After a retracement of more than 50% till around the 13850 satoshis level, EOSBTC has managed to recover quite nicely.
- Then EOSBTC has bounced nicely and has even managed to break a key resistance level at around 17000 satoshis. But that was just for a brief moment cause then it fell back under this level fairly quickly again.
- If BTC move lower and dumps under 7000, then EOSBTC will likely go down with it but since the mainnet is set to launch in a couple of days, the retracement will likely be not as severe as the BTC/the overall market drop so a retracement of 38.2% to 50% is more likely than a 61.8%.
EOSBTC can fall deeper obviously and reach the lower (blue) trendline, which is around the .618 fib. retracement level of the then set 1st wave in white.
- If this retracement is done, EOSBTC has made a higher low and breaks the 17000 satoshis level again, then we're at the start of a wave 3 and also made an inverse head & shoulders pattern so watch out for that as well.
- If BTC doesn't "crash" or move lower, then EOSBTC will have enough news/catalyst and support from the community to move higher from here and we're not done with wave the 1st wave yet. We'll then have to reevaluate the situation and if necessary change count.
So there you have it, a brief update and outlook for EOSBTC. Leave a comment if you have any questions.
Like the post, if you liked it and share it if you loved it. This is for good karma.
And until next time, good luck with your trading!
Disclaimer
This information is not a recommendation to buy or sell. It is to be used for educational purposes only.

EOS/BTC(Patterns AB-CD) buy limit/zone supportEOS is in bearish trend respecting uptrend and forming a triangle
AB-CD pattern
buy limit

EOS Recession for the rest of MayBased on current BTC trends rising and falling at the start of each month my feeling is EOS will follow this trend. If you look a the trend from the previous month, while BTC was climbing in April, EOS followed suit. If the BTC trend continues and we hit bottom levels early next month then EOS should possible follow suit in a similar model as the arrows show.
My personal recommendation would be to hold of any trades until early June and see if the market starts to rise. If so buy up as a new ATH could be possible.

EOSBTC should start the uptrend along side other alt coinsThis post is my personal trading targets, at ur own risk should u wish to purchase EOS based on this chart

EOS goes long on the pass, TOUCHDOWN!I recommend EOS, It is showing no signs of stopping on the ichimoku cloud. I got into this coin at $8.60 but I am realizing now the profit potential for EOS is limitless. This is one of the coins that will do really well within the next coming days and over the next few months. This is a good hold or swing trade.


EOSBTC looking like a bull flag! www.youtube.com
EOS is definitely looking bullish but I would be cautiously optimistic.
The coin is seeing a lot of buyers and the MACD is constricting further into a pennant.
RSI levels are above 60 and volumes are high.
I think this will form another bull flag if the market stays positive!
EOS / BTC The 7th day of Christmas my EOS gave to me, GAINS Hello everyone,
EOS is looking bullish right now and found a falling wedge formed also breakout of it, also formed a small symmetrical triangle in the wedge also broke out of that, the measured move of the falling wedge would be the top white line that label measured move.
All the indicators I have on this chart confirms BULLS have the control, EOS is has been strong this month but will it continue? Stay tuned :)
Leave your ideas and comments below.

EOSUSD (Volume Analysis Prediction 5/04/2018)Ticker: EOSUSD
Exchange: BITFINEX
Signal: mid-term @Long
Trading idea:
Buy from a strong support zone
Excellent risk / reward ratio
If the price is lower, we will have a small loss
The market as a whole, approached a significant resistance, be careful with purchases
Upon reaching the first take, move the stop to the point of a lossless
Entry point: 16.1
Stop: 15.48
Target1: 18.97
Target2: 21.34

EOS WILL YOU BE THE NEXT ETH?Okay today i want to share you about a fenomenal coin in binance
Yeah EOS after bullrun and get the new ath at 240k sat
we need to retrace and because of btc bull run the retrace was so deep but dont worry
EOS still have huge potential to up again because some fucking good FA in here
Okay the price of EOS now is 185 its oke to you to buy instan but i predict btc will go more dip in here
so you can see eos in ideal price at 160-175 k
hmm but i doubt the eos will hit 160k
you ask me why?
Because the fomo still high
the big player is still in
I will tell you something to prove it
okay in my custom indicator the green one is rsi
The RSI is still above 50, so it is the normal retrace to bull run again
I will tell you another one
Ema 13,30,50 they didnt cross or death cross or nothing
we are still in golden cross okay
another one again
you see that ?
the stochastic?
it will up but because of btc the big player is just wait and see to get the cheap more
okay it's all from me
you can join my channel for another signal
t.me
So The Conclusion from the chart is
The Ideal Buy
160-175
Buy at
180-190 is good to
TP 1 210
TP 2 240
TP 3 280
TP 4 300
TP 5 MUN

Waiting to see if a Long opportunity comes along...Eos is moving inside a triangle that can go either way. I still have`nt open a long position. I'm waiting to see if a breakout with high volume occurs. Right now I don’t have clear sense on how far Eos can go, but there are two resistances ahead, which are shown in chart.
In case of a drop, 13047 satoshi is a major support level. For now I'm waiting on sidelines.
I will update this post and will let you know if a good long opportunity happens.

Something to watch on EOSLooking at a similar situation on EOS. Bounce on the 0.618 fib occurred on the first pump and also on this second one. of course it might not happen again but its something to keep in mind. stochrsi and rsi support supports a view of another leg up but it's already done a huge rally so take everything with a grain of salt. tight stop so you dont get rekt

EOS trading ideaHello guys, Eos is getting a lot of traction this days i think it is forming one huge cup+ handle and now is getting back to re-test the surface before it bounce buy orders around 13k are great because not only this was super hard spot for breaking going up now it is fibonacci zone so a lot of retail traders will jump into it. When i buy i will watch out coz a lot of people will have stoplost somewhere there and institutional traders my push the market so they can create short liquidity pool to fill there long positions .

EOS/BTC short opp. EOS has had quite a run. I think it´s time to cool off a pit. Hit the cup and handle target today. I expect someting similar as last time, you can see what happened last time in the chart. Looking for that 0.618 fib level.

A New trading Opportunity to Buy. TP1 hit with 185602 profit…EOS/DOLLAR
New trading suggestion:
*The price is in an up trend, and we forecast the uptrend would Continue.
*There is still possibility of temporary retracement to suggested support line (0.00132), if so, traders can set orders based on Price Action and expect to reach short-term targets.
Entry signal:
Signal to enter the market occurs when the price comes to "Buy zone" then forms one of the reversal patterns, whether "Hammer" or "Valley" , in other words,
NO entry signal when the price comes to the zone BUT after any of reversal patterns is formed in the zone.
To learn more about "Entry signal" and special version of our "Price Action" strategy FOLLOW our lessons:
Trade Setup:
We opened 2 BUY trade(s) @ 0.00074254(day close price) based on the reversal candle ( 2-Day Hammer ) at 03.27.2018.
Total Profit: 185602
Closed trade(s): 57746 Profit
Open trade(s): 127856 Profit
Closed Profit:
TP1 @ 0.00132 touched at 04.20.2018 with 57746 Profit.
Open Profit:
Profit for one trade is 0.00202110(current price) -0.00074254(open price) = 127856
1 trade(s) still open, therefore total profit for open trade(s) is 127856 x 1 = 127856
All SLs moved to Break-even point.
Take Profits:
TP2= Free
Technical analysis:
Eos/Bitcoin is in an Up Trend and Continuation of up trend is expected.
The price is now in the "Buy Zone" of the Bollinger bands and that is above the 21-Day WEMA which acts as a dynamic support.
The RSI is at 86.

A New trading Opportunity to Buy. TP1 hit with 185602 profit...EOS/DOLLAR
New trading suggestion:
*The price is in an up trend, and we forecast the uptrend would Continue.
*There is still possibility of temporary retracement to suggested support line (0.00132), if so, traders can set orders based on Price Action and expect to reach short-term targets.
Trade Setup:
We opened 2 BUY trade(s) @ 0.00074254(day close price) based on the reversal candle ( 2-Day Hammer ) at 03.27.2018.
Total Profit: 185602
Closed trade(s): 57746 Profit
Open trade(s): 127856 Profit
Closed Profit:
TP1 @ 0.00132 touched at 04.20.2018 with 57746 Profit.
Open Profit:
Profit for one trade is 0.00202110(current price) -0.00074254(open price) = 127856
1 trade(s) still open, therefore total profit for open trade(s) is 127856 x 1 = 127856
All SLs moved to Break-even point.
Take Profits:
TP2= Free
Technical analysis:
Eos/Bitcoin is in an Up Trend and Continuation of up trend is expected.
The price is now in the "Buy Zone" of the Bollinger bands and that is above the 21-Day WEMA which acts as a dynamic support.
The RSI is at 86.

EOS/USD Bullish Scenario N. 2This is another possible count, very similar to the previous, but minus the ABCDE correction of the second wave.
We May get a higher high to complete this wave 3, then the safest entry would be to play the wave 4.
Exercising extreme patience is advised.


EOS , broke resistance and now retesting. Nothing to say, it is very clear, a very good risk/reward trade. broke a major line now re-testing it. seems ready to take off.
provided that BTC does not collapse of current trend line.
Good luck

EOSBTC: SHORT TERM BEARISHHello traders,
I'm bearish on EOS short term, we can see a rising wedge and the bearish TK cross that shows ichimoku.
- THIS IS NOT FINANCIAL ADVICE -
