BTCUSD Bybit Chart Analysis May 12
Hello,
“Make it simple, make profit”
It’s BitcoinGuide.
Don’t forget to
“Follow” me and press “Likes”.
If you "follow" press,
Only 30 Min chart ,
In real time, you can check major sections and move,
Real-time "update I dea" can be checked.
I will begin BTCUSD Bybit Bitcoin Chart Analysis for May 12th .
May 11 analysis.
This is the move after the final finish.
It was a long position strategy.
If you click the replay button,
Sky blue finger movement path progress.
Along the orange parallel line
Violet resistance line / Green resistance line breakthrough -> Upward finish.
This is the maximum profit segment of $2,500.
4 hours chart.
Please check today's Top and Bottom prices.
Before and after breaking through the green resistance line
It seems that the direction will be decided.
Please check the approximate movement.
Focusing on this part,
I created today's trading strategy.
This is a 30-minute chart long position strategy.
Green resistance line, orange support line,
Pay attention to the convergence section.
*Red arrow on the path of movement
Long position strategy.
it is a strategy a strong rise.
Stop loss is the orange support line.
The light blue resistance line is the target.
(If the red resistance line is reached, the short position entry section
Uptrend when breaking the red resistance line / Stop loss required)
*On the path of the sky blue finger movement,
Long -> Short -> Long switching strategy.
In the last long position switching,
In case of break away,
You can go down to the red support line at the bottom.
When a variable occurs,
See you in the afternoon live comment.
That’s it for today’s strategy.
We hope that you operate safely as principle trading / stop loss is essential.
Thank you.
EOS

May 12 BTCUSD Bybit Chart Analysis
Hello,
“Make it simple, make profit”
It’s BitcoinGuide.
Don’t forget to
“Follow” me and press “Likes”.
If you "follow" press,
Only 30 Min chart ,
In real time, you can check major sections and move,
Real-time "update I dea" can be checked.
I will begin BTCUSD Bybit Bitcoin Chart Analysis for May 12th .
May 11 analysis.
This is the move after the final finish.
It was a long position strategy.
If you click the replay button,
Sky blue finger movement path progress.
Along the orange parallel line
Violet resistance line / Green resistance line breakthrough -> Upward finish.
This is the maximum profit segment of $2,500.
4 hours chart.
Please check today's Top and Bottom prices.
Before and after breaking through the green resistance line
It seems that the direction will be decided.
Please check the approximate movement.
Focusing on this part,
I created today's trading strategy.
This is a 30-minute chart long position strategy.
Green resistance line, orange support line,
Pay attention to the convergence section.
*Red arrow on the path of movement
Long position strategy.
it is a strategy a strong rise.
Stop loss is the orange support line.
The light blue resistance line is the target.
(If the red resistance line is reached, the short position entry section
Uptrend when breaking the red resistance line / Stop loss required)
*On the path of the sky blue finger movement,
Long -> Short -> Long switching strategy.
In the last long position switching,
In case of break away,
You can go down to the red support line at the bottom.
When a variable occurs,
See you in the afternoon live comment.
That’s it for today’s strategy.
We hope that you operate safely as principle trading / stop loss is essential.
Thank you.

EOS Still Following the Fractal Perfectly (EOY Prediction)Fractal shows peak in late October, most charts based on historic evidence see the bull market ending in late October.
Blue support line matches the fractal perfectly.

EOS/USD Back to ATHRecent Block one exchange news given EOS a lot of volume, as alt season continues it's almost certain eos reaches its ATH and goes further. The BTC pair is on the floor still.

Analyzed BTC, ETH, BCH, HBAR, EOS, LTC, XRP and DOGE | Enjoy ;)NSENG:ACADEMY
Hello everyone 😃
We tried to analyze some of the trending coins for you dears to use it on your trading plans !
Hope you all enjoy it 😉
I will start with BTC -> ETH -> BCH -> HBAR -> EOS -> LTC -> XRP -> DOGE.
BTC/USDT :
BTC is currently at no trade zone, There are many pressure zones and we can't select a correct direction for it.
But based on our data; BTC is generally bullish on 12H timeframe, So the most possible direction will be another reach on 59K after a retest on lower trendline.
🔴 Any engulf below 52K will makes BTC more bearish !
ETH/USDT :
ETH is at resistance zone which is located at FIBBO level. Any close above this level will confirm $4700.
But on low TF, ETH remains bearish until it breaks $4255 level !
So Be careful of your funds on ETH, Also there was a formed H&S which is invalidated now.
BCH/USDT :
BCH is at the verge of bullish cross, But there is a stiff resistance above which can rejects BCH if others ( other major coins ) don't go up in next hours...
Also there is a chance for fake-out on it ! So better to watch ETH's current resistance and BTC's closes above current order block.
I really like to have a retest on lower levels for BCH; $1800 is confirmed already for BCH...
📌 You can set your bids at green mentioned zones !
HBAR/USDT :
Personally, I'm seeing HBAR as a greater technology for crypto; So that's why it's in my watchlist !
Anyway, HBAR retests demand zone and now it's trying to climb for bearish order block.
Also It remains bearish on technical indicators for short-term, So another retest on bullish trendline is very expected.
EOS/USDT :
I'm not very sure about EOS, It's remains bullish without any excuse !
Current level is suggested as a stiff resistance zone; Sadly I expected that EOS will show more low wicks...
But it didn't went on my plan. Now I'm waiting for a rejection from this level or a breakout above this level !
Both of them are considered as a great opportunity for scalpers and swing traders...
LTC/USDT :
LTC is lovely here, I'm just searching for any retest on lower levels; Which is really expected for next days...
I'm still believe in my final target around $700 in next 4 weeks ! So I will set my beads at lower demand levels.
XRP/USDT :
There are two possible directions for XRP, It's seems that XRP is moving into a falling wedge, So it's generally very bullish...
Any close above wedge's higher will confirm XRP's $2 in mid-term and higher levels for long-term.
Otherwise we'll see a lower retest to $1 bullish order block zone. After that I will aiming $2 again !
DOGE/USDT :
DOGE is no more staying in a bullish scenario for now. It rejects 50% and 68% retracement on FIBBO's bullish wave, And now it's moving around 70% on FIBBO's bullish wave.
But on bearish wave, It seems that DOGE has retested FIBBO's 50% level and now it's standing below 38.2%.
So any rejection below $0.4 stiff support zone can make this opportunity for bears to push it around $0.3 level !
Bulls can take the lead one more time for DOGE if they manage to break current bearish trendline...
Hope you enjoyed our multiple analysis about 7 crypto currencies in my watchlist🙌
You can support us with your likes.
Also you can share your opinion with us in comments 😉🙋🏼♂️
Attention: this isn't financial advice we are just trying to help people on their own vision.
Have a good day!
@Helical_Trades

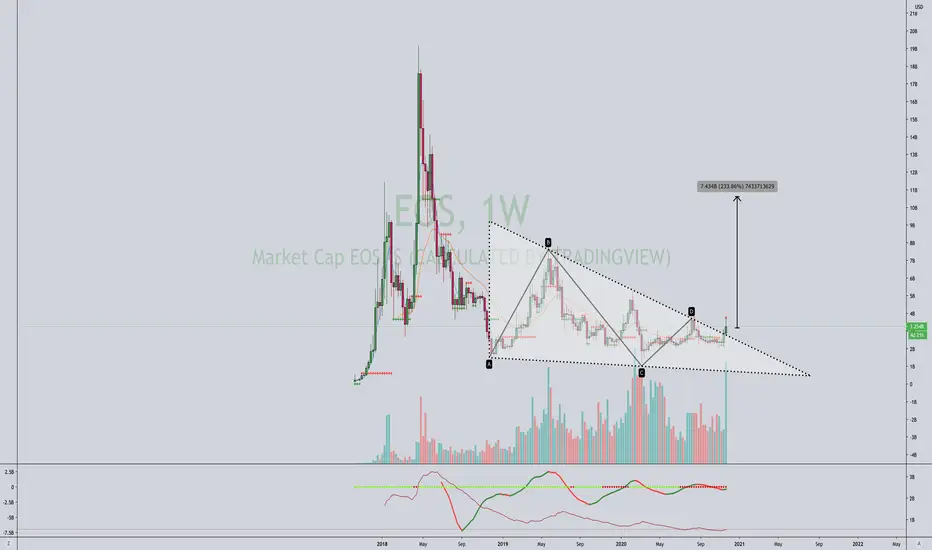
EOS BULL NEW TargetsEOS Bitcoin chart. Big fundamental news for EOS. Block.one and partners raise $10B to launch EOS-based crypto exchange, among with investors Mike Novogratz, Peter Thiel's, Alan Howard, Louis Bacon, Richard Li, Christian Angermayer, Galaxy Digital and Nomura bank. This analysis is my own opinion, not financial advise. Red lines are my Take Profit, blue lines 10% Profit taking
My past idea on EOS below

broadening wedge breakout$eos broadening channel break. 1.68 target is in line with broadening wedge target #EOS
watch for retest of trendline and then big bounce up.
DYOR and GL!

Big long if can brock the resistance Big long if can break the resistance - there are 3 big resistance in road

Last Chance get in EOS!EOS is retesting and breaking out i think. target: 20 dollar. If you are trading on Binance, you can buy EOSUP to make more profit(its leveraged)

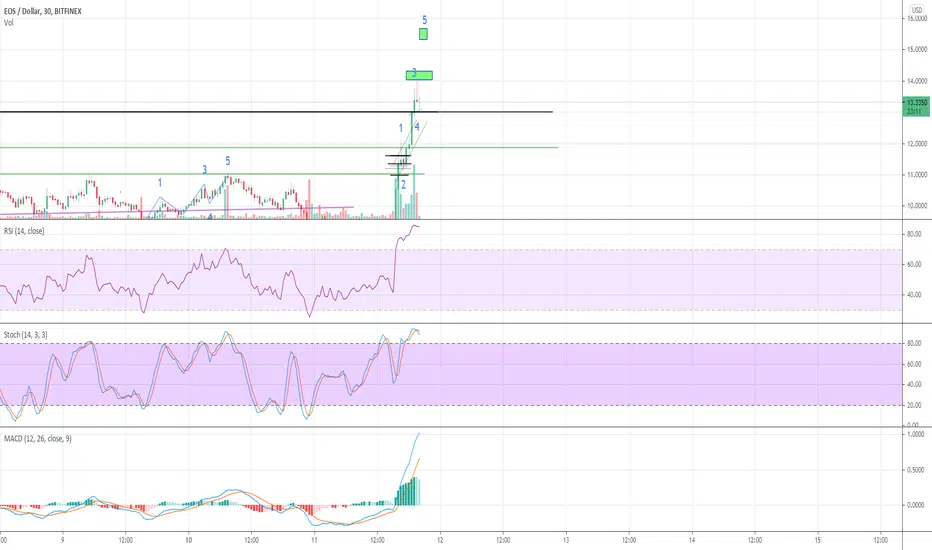
Short-term target 15.5 USDa sensible 1 to 1 extension of the 5th wave should be in the area of 15.5 USD.today 11th of may

$EOS news, a BULLISH chart...EMA & RSI pointing NORTHFrom the looks $EOS may be challenging 2018 highs soon. A measured move on the daily charts points it north of $16. A close in the mid 12s range would increase probabilities. Get your popcorn ready.
#Daytrading #altcoins #EOS #BTC #cryptocurrency


NEED HELP WITH ALTCOINS?Hello everyone.
✅ Again, I've decided to do a few analysis for you guys.
👍🏽 All you need to do is to CLICK LIKE, name a coin, and then tell me if you need the short-term, or the long-term analysis. And I will analyze the most mentioned coins for you guys.
🔈 Follow me to get the analysis you asked for.
Happy Trading 🍸
Good Luck 🎲
Like and Share 🗣✅

EOSBTC 1W long setup; Breakout of long lasting downtrendTA explained
EOS broke out of the long lasting downtrend which developed within the parallel downward channel. Price broke out and pulled back towards the broken trendline. A little more pullback can be expected which might also wick through the lower entry price.
Final target aligns with the 0.618 fib retracement level. SL is a bit wider than usually, risking a bit more on this trade because of the potential profit.
Trade setup
Best entries: 0.0001228 - 0.0001660
TP1: 0.0003299
TP2: 0.0005507
TP3: 0.0009781
TP4: 0.0015790
SL: 0.0000909
RR: 17.73
Max leverage: na
—————
Do Your Own Research (of course)
Trade at own risk (of course)
Only trade what you can afford to lose (of course)


MY MINIMALIST CHART ANALYSIS FOR $EOS$EOS - EOS ON A DAILY CHART
5.10.21 0456H +8 PACIFIC
MY PRACTICE MINIMALIST ANALYSIS
ENTRY AND EXIT POINTS FOR A SWING TRADE
USING RANGE BOXES AND FIBS
Note:
Run your Fibs at the top and bottom of
the big and small range boxes together
with your chart for your target exits and
stop-loss.
This is not a piece of financial advice.
I am just a student and still learning.
Adjustments will be made in
accordance with The Dynamics of the
Market along with Trading Psychology.
Caution, Trade what you see and not
trade what you think.
Postings are done most of the time will be
delayed, as it takes time for me to finish
on several assets.
Updates will be posted religiously if time
permits.


Parabolic Curve pattern idea for $EOS USDTThis is a personal research and idea for investment. DYOR and TIT...
This is $EOS coin against USDT pair on a daily chart .
ABBREVIATIONS
Parabolic Curve Theory ( PCT )
Price Action (PA)
BTC ( Bitcoin )
T/K (Tenkan/Kijun Blue/Yellow lines)
:::DISCLAIMER:::
This is a long-term pattern that probably will develop exponentially growing price action as it starts to close. It seems consistent to PCT as we get higher highs and posterior ranging at key Fibonacci levels and there's also a sub-base 1, midway to the .236 fib (base 1 or .b1).
See as .b1.1 or as like I call it, sub-base 1 is touched at mid-height from the base of the Parabola to base 1 (.b1)
As I'm looking at this chart and describing my idea I'm very conscious that events like news catalysts and BTC volatility can deviate it off its course and make price action wonder outside the confines of the pattern invalidating or at least demanding a reassessment of the idea.
TIME/PRICE PROJECTION
Pattern start: Late-Jan 2021
Estimated end: Q4 2021 (5 months from publishing)
Price tag at time of publishing: 10,3871USDT
Expected price tag at end of pattern: 25USDT
Safe trailing take profit area: I will assess this as the pattern develops.
TECH INDICATORS
Ichimoku indicators:
-Bullish Kumo cloud.
- Span A and B flattening suggests consolidation period.
- PA above Kumo, bullish sign.
- Bullish T/K crossup 5 days ago from this publishing is also bullish.
- Chikou lagging span far and high.
- Parabolic SAR indicates bullish trend.
Trade at your own risk...
NEWS CATALYSTS AND BTC VOLATILITY
No major news upcoming this year related to coin.
Seems affected by BTC dips.
EXPECTATIONS
I expect a completion of the pattern if BTC doesn't pull PA out of pattern. If it does, this idea may need to be revisited.
$EOS at least at 25USDT price tag within months from now.
FINAL NOTE
Drawing may need some minor adjusting as the pattern develops.
