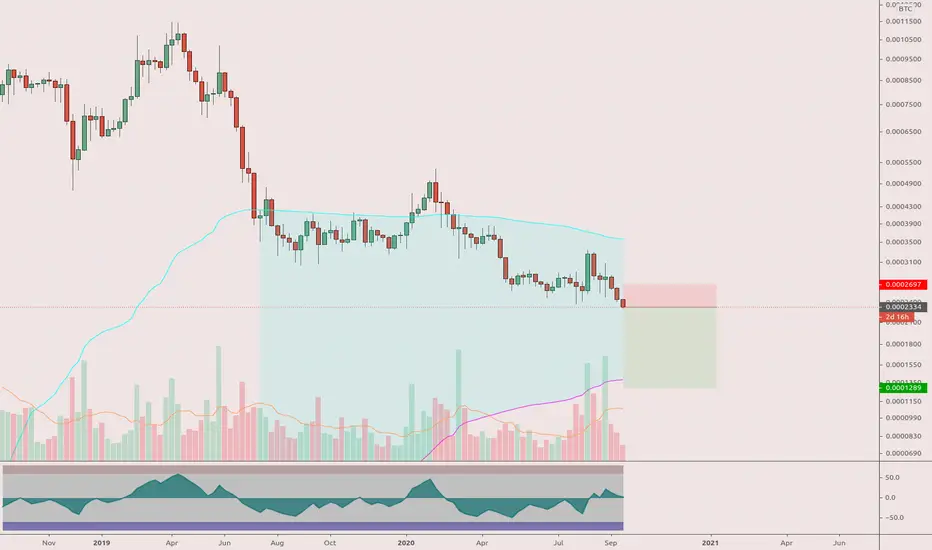
EOS, best place to Buy for Long-Term 🌶️EOS was in a long-term down trend, as you can see in the daily chart, This Trend is broken and it's retested..
If you're looking for a reliable coin that it is on a good entry point so you can hold it for long-term, EOS IS THE ONE!!!
I'm confident about the take profit points I've shown you on the chart and of course it can go beyond, but it needs more information so I can analyze it.. It's a 150% to 200% profit depends on when you buy it..
Besides all this, I could use some help from you, I want to know if you have any idea about how EOS is going to reach around the 8$ target that I've shown?? I gave you my opinion with the red arrow in the chart.. I'll be glad to read or see your answers with you charts..
Feel free to ask me any question about the chart..
This is my idea.. What do you think??
EOSBTC

EOS IS LATE TO BREAK OUT AND IS FORMING A MASSIVE SYM TRIANGLEHello Traders,
EOS seems to have been one of the weakest performing alt coins and has not yes broken resistance. The price looks like its trying to break resistance and has formed a massive symmetrical triangle on the daily.
Im bullish here. As with all symmetrical triangles wait for the breakout direction to be confirmed and then buy/sell into strength.

EOS JET READY - EOSBTC EOSUSDT EOSUSDC EOSUSD EOSBITCOINEOS JET READY - EOSBTC EOSUSDT EOSUSDC EOSUSD EOSBITCOIN

EOS to 8$ by jun-july 2021eos as one of the best blockchains is cheap ! theres a triangle in weekly that we are retesting right now . everybody talk about xrp and explode but no one talk about eos . im gonna get a bag of eos and hold for long term


EOSBTCGonna go out on a limb and say that EOS may start to have some good weeks against BTC..
thoughts/comments?
tg


EOSUSD The Triangle Very young, a lot of growth and cycles to experience yet.
Very close to breaking point of the triangle also!
MACD is rising.

EOSETH Bearish continuation, potential bottom? Explains on chart.
Would go long but my ledger doesn't support EOS!
Think its a great project and a potential rival to ETH.

EOSUSDT ( Symmetric Triangle Breakout)#EOSUSDT (1H CHART) Technical Analysis Update
Symmetric Triangle breakout
EOS/USDT currently trading at $2.95
LONG ENTRY LEVEL: $2.90- 2.95
STOP LOSS ( support): Below 2.80$
Resistance level 1(Target) : $3.35
Resistance Level 2(Target): $3.70
Max Leverage: 5X
ALWAYS KEEP STOP LOSS...
Follow our Tradingview Account for more Technical Analysis Update, | Like, Share and Comment your thoughts

Potential 14x incomingIt looks like EOS is coming close to breaking out of a massive descending triangle.
There's a smaller descending triangle EOS is about to break out first, which will put it up by 140%.
The second massive descending triangle would be putting it up by around 1400%!
Currently it sit's closely on a support level around 0.00015619 and is likely to break out of the first smaller triangle within 1 - 3 more bars ( weeks ).
A breakout of the smaller descending triangle will automatically lead to a push above the resistance line of the second massive descending triangle which was previously touched 4 times already.
The RSI shows EOS currently in an oversold area, so it looks like a good entry point as well.

EOS/USDT ( Symmetric Triangle in 1 Hour Chart)Symmetric Triangle Breakout
EOS/USDT currently trading at $3.54
LONG ENTRY: Only enter long after Symmetric Triangle Breakout in 1 h chart
STOP LOSS: I will update soon
Resistance level 1( Target): $3.95
Resistance level 2 (Targe ): $5.50
Resistance level 3 (Target ): $8.65
Max Leverage: 10X
ALWAYS KEEP STOP LOSS...
Follow our Tradingview Account for more Technical Analysis Update, | Like, Share and Comment your thoughts

EOS (EOSUSDT) Breakout Setupprice break the trend line with good volume and looks really good for long setup
if we hold above this zone than eos price can move really higher


EOS Is Going To Explode To The Upside #ALTSEASONMartyBoots here. I have been trading for 13-14 years and I am here to share my ideas with you to help the Crypto space.
Bitcoin Bull Market could be here right now
EOS Is Very Bullish right now and will move a lot higher
If you want help trading Bitcoin or any other ALT coins hit me up , We will improve your trading . Have a look at the link below

EOS Breaks The Falling Wedge, Up Until Mid-Dec.EOS Token (EOSBTC) will not stay behind compared to other altcoins, ADABTC, BCHBTC, XRPBTC, XRPUSD, etc... It will also move up.
These altcoins will go up and do good until around mid- or late December. You read it here first 😊
Here we have a falling wedge that's already breaking bullish.
We have prices moving above EMA10.
Both the RSI and MACD are still low but clearly trending higher...
The other pairs, let's call them EOS brothers and sisters, are already moving bullish and they tend to move together.
The numbers you see on the chart are the targets.
The red dashed line at the bottom is the support.
For any questions leave a comment.
Namaste.


Now or NeverEos is currently at its turning point with a gradual increase in upwards momentum if it continues breaking upwards or even sideways we can expect huge potential upside within the following 2 months.
price prediction:$6.90 by mid December

EOS Easy Targets - EOSBTC EOSUSDT EOSUSDC EOSUSD EOSBITCOINEOS Easy Targets - EOSBTC EOSUSDT EOSUSDC EOSUSD EOSBITCOIN


EOS/USDT Reversing from the Support zone EOSUSDT Currently trading at 2.480
Entry level : $2.45 - 2.48
Resistance 1 : $2.54
Resistance 2: $ 2.62
Stop loss: Below $2.44
Risk Reward Ratio : 1: 4
ALWAYS KEEP STOP LOSS...
