EOSUSD D1: Best level to BUY/HOLD 25%/35% gains(NEW)Why get subbed to to me on Tradingview?
-TOP author on TradingView
-15+ years experience in markets
-Professional chart break downs
-Premium content
-not just random lines on the chart
-Supply/Demand Zones
-TD9 counts / combo review
-Key S/R levels
-No junk on my charts
-Frequent updates
-Covering FX/crypto/US stocks
-24/7 uptime so constant updates
EOSUSD D1: Best level to BUY/HOLD 25%/35% gains(NEW)
IMPORTANT NOTE: speculative setup. do your own
due dill. use STOP LOSS. don't overleverage.
Tagged LONG because I expect strong BOUNCE
off the lows, HOWEVER read entire idea
before executing. DO NOT market BUY now.
🔸 Summary and potential trade setup
::: EOSUSD 1days/candle chart review/outlook
::: BUY/HOLD setup for 25%/35% gains
::: will bounce from confirmed horizontal
::: key S/R level (4 reversal)
::: BUY HOLD setup for BULLS 25%/35% gains
::: expecting target to get hit
::: within 3-4 weeks
::: my target is 2.80 end of February
::: BULLS should seek to BUY LOW
::: 25%/35% gains possible for BUY/HOLD
::: this is BUY/HOLD Setup
::: for patient traders only / no fast gains here
::: good luck traders
🔸 Supply/Demand Zones
::: N/A
::: N/A
🔸 Other noteworthy technicals/fundies
::: TD9 /Combo update: N/A
::: Sentiment short-term: BULLS/35% gains
::: Sentiment outlook mid-term: BULLS/35% gains
EOSUSD

MAC-D Ticking Red on Hidden Divergence.. Bulls need to come out MAC-D is ticking red and we are so close to breakout out if we just get some bullish momentum.. BULLS!!! LETS MAKE EOS GREAT AGAIN!!!

What is wrong with EOS????This coin is taking the longest nap of it's life during the biggest bull run yet. How has this gone horizontal for so long? The weekly RSI looks great and it seems that someone is buying... I could see it doubling in price one day, but I don't know if that will be next week or in another year.


EOS not filling the fuel?Gues what
this is the graph that i can tell.
EOS need more volume if want to flying a roket.
there will be more sideways for this pair at the moment.
but do not overlook.
Current price
rank 13
$3.57 USD (13.74%)
0.00018966 BTC (12.09%)

Eos (EOS) -January 24Hello?
Dear traders, nice to meet you.
"Like" is a huge force for me.
By "following" you can always get new information quickly.
Thank you for always supporting me.
-------------------------------------------------- -----
We have to see if we can get support at 26899 and ascend above 2.8250.
In particular, it remains to be seen if it can rise above the downtrend line (3).
You should watch for any movement that deviates from the 2.1243-4.0849 section of the big box.
-------------------------------------------------- -------------------------------------------
** All indicators are lagging indicators.
So, it's important to be aware that the indicator moves accordingly with the movement of price and volume.
Just for convenience, we are talking upside down for interpretation of the indicators.
** The wRSI_SR indicator is an indicator created by adding settings and options from the existing Stochastic RSI indicator.
Hence, the interpretation is the same as the conventional Stochastic RSI indicator. (K, D line -> R, S line)
** The OBV indicator was re-created by applying a formula from the DepthHouse Trading indicator, an indicator that oh92 disclosed. (Thank you for this.)
** Check support, resistance, and abbreviation points.
** Support or resistance is based on the closing price of the 1D chart.
** All explanations are for reference only and do not guarantee profit or loss on investment.
Explanation of abbreviations displayed on the chart
R: A point or section of resistance that requires a response to preserve profits
S-L: Stop Loss point or section
S: A point or segment that can be bought for profit generation as a support point or segment
(Short-term Stop Loss can be said to be a point where profits or losses can be preserved or additionally entered through installment transactions. It is a short-term investment perspective.)
GAP refers to the difference in prices that occurred when the stock market, CME, and BAKKT exchanges were closed because they do not trade 24 hours a day.
G1: closing price when closed
G2: Market price at the time of opening
(Example) Gap (G1-G2)

EOS - 4h. Buyers do not give up and prepare for the test $3.9.Hard times came on the EOS market on January 10. After breaking the global trend line, buyers tested the mark of $3.9 and were confident that the downward trend was over.
However, the sellers decided otherwise and lowered the price in less than two days by 40% . After such a fall, the EOS market froze for almost 2 weeks.
However, yesterday we saw a good signal . During another attempt by sellers to break the critical range of $2.42-2.5, we saw too low volumes . Compared to January 11, this situation looks like the capitulation of sellers and the transition of initiative in the EOS market to buyers.
Today we saw an aggressive attempt by buyers to form a new local trend . Fixing the EOS price above $2.93 will be the first signal to continue growth with a target of $3.9.
Another good signal was the situation on the EOSBTC chart:
YES we see on the chart a strong downward trend. However, pay attention to the volumes that have finally appeared on the EOS market. In our opinion, a large buyer is actively buying EOS, while the situation allows it to do so at low prices.
_______________________
We create both short-term ideas (for a local understanding of the market situation) and medium-term forecasts of price movements.
Subscribe to us and get daily concise analytics!


💡 EOS : BUY TradeFrom so many days eos is in strong accumulation. recently eos founder left the project news also affected the coin growth.
but chart is becoming bullish, just invest 1% capital.

EOS / USDT weekly analysis As we saw on our previous analysis,
i believe that EOS / USDT might be at the end of a long and strong reversal pattern on the weekly timeframe
The candle that closed the last week, told us a bit more about what's coming ...
We closed the week with a Hammer and a long volume candle.
The Volume and Price analysis tell us a story in this combination.
During the session, sellers pushed the price down but their efforts were counter by the strength of the buyers which allowed the market to recover. This anomaly on the price-volume combination shows us that little by little sellers are capitulating ...
This weekly closure is actually comforting us in a successful reversal pattern, that will drive us to a strong bull run !
The content covered in this publication is NOT to be considered as investment advice.
Thank you all,
If you enjoyed this analysis please mark a thumbs up and do not hesitate to share your point of view in the comment section.
Have a Good day and Safe trade
Butterfly .D
/Metamorphose your portfolio/

EOS Education: Range TradingExtreme wicks in quick succession, such as a blow-off top and a quick dump, establish a range.
1. Identify range extremes (high/low) at the ends of the candle wicks
2. Plot the Fibonacci levels
3. Important levels to mark are around the 0.25, 0.5, 0.75
- 0.75 tends to be the first Higher Low (HL)
- 0.5-0.618 is the Range Equilibrium (Range EQ) and price tends to test it as support/resistance numerous times.
- 0.25 tends to be the first rejection after dumping from range high
HOW OT PLAY RANGE:
- after dump from range high to range low (range established), look to long after reclaiming the 0.75 as support.
- If price rejects Range EQ with a sharp bearish engulfing candle, short.
- If price breaks Range EQ and retests as support, long
- If price bounced from Range EQ, look to take profits at 0.25
- If price rejects 0.25 with bearish engulfing candle, short
RANGE BREAKOUTS:
- Often ranges will exhibit "fakeouts" to either side. After establishing the range low, price could bounce and make a Lower High around Range EQ. Typically price will then return to range low, wick slightly below and then immediately snap back into the range. This is a " false breakdown"
- The inverse is true as well. Price could hold range EQ as support and then pump hard and breakout of the range high, wick beyond it and fail to hold range high as support. The price will then return to the range, thus creating a " false breakout "
- This is important as fakeouts tend to shake out the weak hands. When it breaks range low, stop losses at range low are often hit thus creating a liquidation dump.
- Upon breaking range high, many novice traders experience FOMO and market long. They get liquidated because they're stop losses are oftetn placed at range high at this point, so when price fails to hold range high as support they get liquidated causing a massive dump back into the range.
SUMMARY:
- Watch Fibonacci levels
- Don't FOMO the breakouts. Wait for clear retests of range extremes as support/resistance before entering a trade.
- In EOS right now, a quick scalp could be made if we hold 0.25 as support.
- Otherwise, look to long a successful retest of range high as support before longing.

EOS Weekly Timeframe, Near To Break the Long-time ResistanceAs you can see in this weekly timeframe, EOS is trying to break the weekly resistance and in the first step, I expect $7.40 soon.


HUGE swing squeeze for EOS?Does this mean anything to anybody? Honestly I'm not sure if this has significance at all.

Eos (EOS) -January 17Happy New Year!!!
Dear traders, nice to meet you.
"Like" is a huge force for me.
By "following" you can always get new information quickly.
Thank you for always supporting me.
-------------------------------------------------- -----
You should watch for any movement that deviates from the critical section 2.4577-2.8250.
We also have to see if it could break off the downtrend line (2) leading to further upside.
If it falls at 2.4577, it is a short-term stop loss.
BTC price volatility can temporarily touch the 2.1243 point, so careful trading is required.
At this point, you have to watch to see if it ascends quickly near the 2.4577 point.
If it falls from the 2.1243 point, a Stop Loss is required to preserve profit and loss.
-------------------------------------------------- -------------------------------------------
** All indicators are lagging indicators.
So, it's important to be aware that the indicator moves accordingly with the movement of price and volume.
Just for convenience, we are talking upside down for interpretation of the indicators.
** The wRSI_SR indicator is an indicator created by adding settings and options from the existing Stochastic RSI indicator.
Hence, the interpretation is the same as the conventional Stochastic RSI indicator. (K, D line -> R, S line)
** Check support, resistance, and abbreviation points.
** Support or resistance is based on the closing price of the 1D chart.
** All explanations are for reference only and do not guarantee profit or loss on investment.
Explanation of abbreviations displayed on the chart
R: A point or section of resistance that requires a response to preserve profits
S-L: Stop Loss point or section
S: A point or segment that can be bought for profit generation as a support point or segment
(Short-term Stop Loss can be said to be a point where profits or losses can be preserved or additionally entered through installment transactions. It is a short-term investment perspective.
GAP refers to the difference in prices that occurred when the stock market, CME, and BAKKT exchanges were closed because they do not trade 24 hours a day.
G1: Closed price
G2: Market price at the time of opening
(Example) Gap (G1-G2)


ALT Season - What to look in to choose a coinWe waited for it since 4 years, alt season is on the corner. We see first movements on most bullish alts like RSR, VET, REN, etc.
But what is the most important right now : find those that didnt pump yet. And when they do pump, make sure we roll profit in some
alts that didnt pump yet.
Here is my best trick for you : they all tend to follow BTC 2020 parabola pattern. BUT THEY ARE LATE. We see them coming!
We see it in all category of alts : from Major caps to shitcoins.
I give you an example here with RSR, one of the most hyped alt coin.


#EOS Breakout Soon, Build Your Position NowEOS is forming an ascending triangle and we see a breakout soon. $2.83 is the breakout point and after that, we see a quick rally in EOS. EOS will likely follow XTZ. Build your position now and hold. EOS has not moved yet while others are pumping. Don't miss it out.
Buy Zone: Below $2.8
Target: $3.05 - $3.24 - $3.42 - $3.6 - $3.85

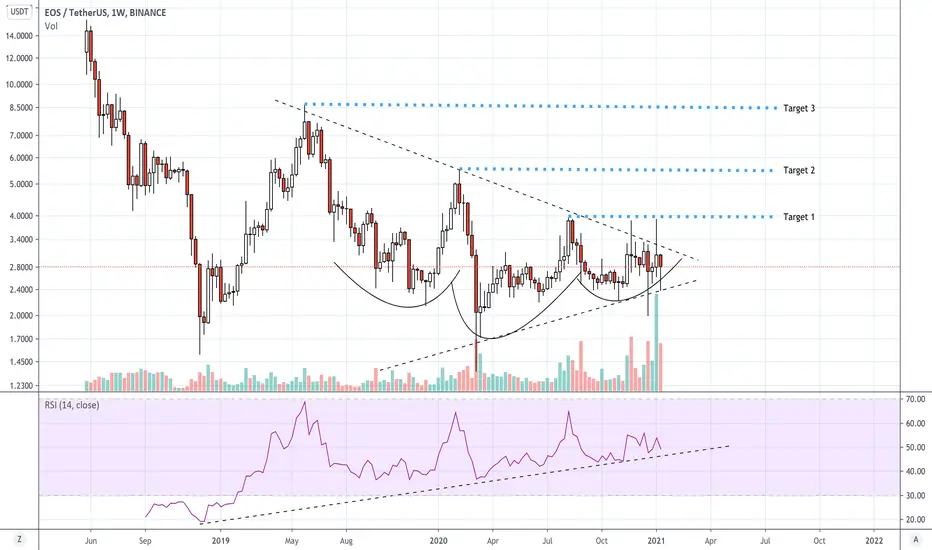
EOS / USDT weekly analysis EOS might be at the end of a reversal pattern on the weekly time frame
Looks like we have the formation of an inverted head and shoulders pattern on the weekly time frame. If this reversal pattern is confirmed by a breakout with strong volume and a weekly closure above the resistance line, the next few weeks will be explosive for EOS!
Even if the fundamentals news are not that great lastly, with the departure of the CTO and a lot of competitors for EOS, on the technical part i believe we are arriving at the end of a long and painful accumulation phase + we are living a very strong Bull market ... Keep an eye on this one, the breakout could be strong !
However, till the breakout is not confirmed, no reason to make some moon prediction
The content covered in this publication is NOT to be considered as investment advice.
Thank you all,
If you enjoyed this analysis please mark a thumbs up and do not hesitate to share your point of view in the comment section.
Have a Good day and Safe trade
Butterfly .D
/Metamorphose your portfolio/
EOSUSDT Price outlook 13 January 2021 — EOS UPLooking forward EOS price rise, since previous update gained +10%
For triangle setup we can use Stop loss below support $2.5
Take profits at $3.0 and possible higher.

