EOSUSDT Elliott Waves AnalysisHello friends.
Please support my work by clicking the LIKE button👍(If you liked). Also i will appreciate for ur activity. Thank you!
Everything on the chart.
Two possible options on the chart, in any case in midterm waiting for upward movement.
Entry: Market and lower
Targets: 1.3 and 1.9
Stop: (depending of ur risk).
ALWAYS follow ur RM.
risk is justified
Good luck everyone!
Follow me on TRADINGView, if you don't want to miss my next analysis or signals.
It's not financial advice.
Dont Forget, always make your own research before to trade my ideas!
Open to any questions and suggestions
Eosusdt

EOS/USDT Ready for an Exponential Bull Run?👀🚀 EOS Analysis💎Paradisers, let's zoom in on #EOSUSDT, where the latest market trends hint at a ripe opportunity for a bullish pivot from a critical support area.
💎A glance at #EOS's recent trading performance reveals a significant 60% retreat from its preceding high. Yet, the steadfastness shown at the $0.64 support level sparks optimism for a potential reversal.
💎The journey to surpass previous peaks or set new records has been challenging, fostering a temporary bearish sentiment. However, the pivotal $0.64 threshold is instrumental for NYSE:EOS , teetering on the edge of unleashing a notable bullish shift upon reassessment.
💎Ever ready for what the market throws our way, we've devised a backup plan. Should #EOS dip further below this foundational support, our sights are set on a bullish revival starting from the alternate support at $0.522. It's important to acknowledge that breaching this boundary could signal a prolonged bearish period.
💎Maintain adaptability in your trading strategy and keep a close watch on market fluxes, Paradisers. Your ParadiseTeam is vigilantly tracking these developments, poised to navigate you through the unfolding market scenarios.

EOSUSDTHi guys
In my opinion, the rising guard of the chart is quite evident.
The condition of the above scenario for us is to maintain the support range of $0.6. Be sure to note that the reviewed process is long-term.
On the 4-hour time frame, we have a head and shoulder pattern at the end of the downward trend. Would you like to check on your chart (;
what do you think!?

EOS (EOS/USDT): Buy the dip with Target around 3.10EOS is a blockchain-based, fully decentralized network that enables the development, hosting, and execution of commercial-scale decentralized applications. EOS supports all of the core functionality required to allow businesses and individuals to create these dApps in a way that is nearly identical to how traditional web applications are created. EOS has the ability to provide secure access and authentication, data hosting, usage management, permissioning, and communication between dApps and the internet. Some even compare the way EOS operates to Google’s Play Store or Apple’s App Store.
🔴 How Does EOS Work?
EOS is designed to resemble the performance of a real computer, with even the software itself using some familiar computing concepts. As an example, there are three types of resources that power the EOS blockchain:
✔ Bandwidth – responsible for relaying information across the network.
✔ Computation (CPU) – the actual processing power needed to run a dApp.
✔ State Storage (RAM) – stores data on the blockchain that can be referenced instantly.
🔴 What Makes EOS Unique?
EOS is a unique crypto project as it encompasses several important characteristics, such as:
✔ Scalability – one of the biggest problems of cryptocurrencies is balancing decentralization and scalability. Due to its Delegated Proof of Stake (DPoS) consensus mechanism, the EOS ecosystem has the ability to process around 1 million transactions per second. The EOS project achieves such a high throughput by utilizing parallel processing.
✔ Flexibility – unlike Ethereum, which can potentially be a victim of DAO attacks, EOS has created a solution for this problem. The platform can halt the node that processes such a transaction, and gets back to processing new transactions only after this problem is resolved.
✔ Decentralization – while Ethereum has often been referred to as the decentralized supercomputer, the EOS platform could be considered a decentralized operating system.
EOS’s value is derived from its ability to act as a platform for smart contracts and dApp creation. This feature makes it one of the few platforms that can be considered a “full package deal”. On top of that, its token economy and structure allow its users to actively be a part of the decision-making process, which is a feature many in the blockchain space appreciate.
There are currently a bit over 950 million EOS tokens in circulation out of the 1,027,411,229 total tokens available.
It should be noted that there is no limit to how many tokens can be minted, with new tokens being released in circulation each time a new block is created. The number of total EOS in circulation can be increased by 5% each year.
📈 Technical Analysis
From a technical point of view, the trend is still bearish on daily and weekly charts, but at the same time we think that a Crypto Accumulation Strategy ("Buy the Dip") could be interesting in mid-long term. As we can see on daily chart, the potential target is very ambitious, but we're sure that sooner or later it will be reached!
Don't miss the next updates and don't forget "Like and Comment" ❤

EOS time for action my aliens.A little T.A on EOS.
Targets are 1.580-1.799 - 2.2 then 3,2-3.3 dollars
Im on 4x and 10x leverage on two different positions on this trade.
Entry is around 0.980 on 4x and 1.040 average on 10x position.
Simple and easy.

EOS The Lost GiantNowadays this dinosaur has zero interest from anyone.
But, I've noticed how the past 2-3 months, someone increased the volume and accumulated between 0.50 and 1$, silently so nobody notices.
I entered the trade at 0.89$ with targets specified by the red lines.
If, btc makes a sudden dump, I'll buy more.
EOS can easily make 100-300% from here if the market conditions stay bullish.

EOS GIANT MONTHLY ACCUMULATIONThis one is INSANE. EOS IS A SLEEPING GIANT! Need I say more?? Shitcoin season is here, lets go!!

EOS/USD Secondary trend. Wedge. Price lows. 13 10 2023Logarithm. Time frame is 3 days. Linear for clarity. The price has reached the historical lows of 2017. The descending wedge is in the final phase of its formation. Percentages show adequate medium-term targets from the breakout of the wedge.
Local trend Time frame 1 day.
Major trend Time frame 1 month. (published 1.5 years ago)
EOS/USD Main trend. Channel

EOS/USDT Local trend 15 07 2023Logarithm. Time frame is 3 days. Near the zone of historical lows. Asset accumulation zone.
This idea, is an update of a previous local work idea (11 local work updates (the entire zone of this accumulation.)
EOS/USD Local work. Reversal zone. % Published one year ago on 29 07 2022
Local reversal zone .
Important mirror resistance level (former support) marked in yellow color. Percentages from the reversal zone to key local support/resistance levels are shown for clarity and general picture.
Local trend Time frame 3 days. Linear for clarity.
Major trend. Time frame 1 month (published 29 07 2022) All up to date.
EOS/USD Main trend. Channel
Secondary trend. Time frame 3 days (published on 07/29/2022) All up to date.
EOS/USD Secondary trend.
The basis of trading is logic, mathematics and psychology, if even simpler, a trading strategy built on the ratio of risk management, that is, discipline and logic, which is a reflection of human personality (psychology of behavior).
Everything is much simpler... After all, in 95% of cases it is known in advance where the price will go with a high probability... but most people do not see it, or rather do not accept it, because they want to see what is profitable for them... and not what is actually there.

EOS/USDT Bullish Leap from Support Zone? 🚀EOS analysis💎 Paradisers, brace yourselves for a promising trading opportunity with #EOSUSDT, currently nestled in a crucial support zone and signaling a potential bullish pivot.
💎 Delving into the #EOSNetwork's journey, it's currently on an ascent from significant support at $0.5213. With the price inching towards the resistance level at $0.757, a successful breach and maintenance above this threshold could herald a march towards conquering the next resistance level, with sights set beyond the current bearish Order Block.
💎 Should momentum for #EOS diminish, we might witness a bullish revival from the solid support at $0.725. However, slipping below this marker could lead to a considerable downturn.
💎 On a related note, the EOS community is buzzing with anticipation over the Kelexo (KLXO) presale, attracting notable attention from EOS investors.

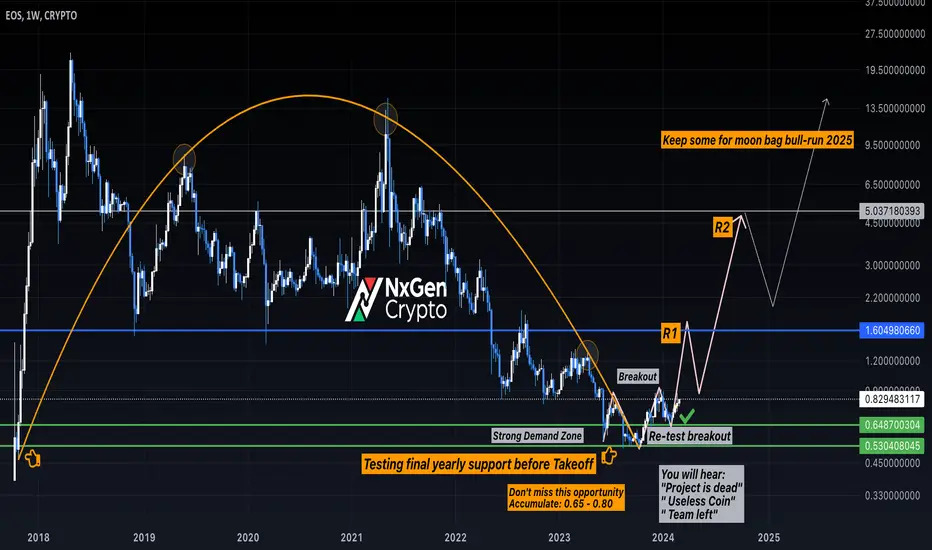
EOS is it dead or....EOS Tested final yearly support before Takeoff then did breakout and retested that breakout in a clear textbook way.
Targets: Next is $1.6 zone then correction back to $0.9 then to a higher zone of $5
I don't think this project is dead, it is just people's emotions lost hope in it due to price movement and that is why I think it is a highly undervalued Layer 1 coin.
EOS LOOKS BULLISHIas seems to be inside a diamond diametric that is about to start a bullish wave E.
This diametric started from the place where we entered "start" on the chart.
By maintaining the green range, it can move towards the red range
Closing a 4-hour candle below the invalidation level will violate the analysis.
For risk management, please don't forget stop loss and capital management
Comment if you have any questions
Thank You

Eos/Usdt Looks Very Promising Here EOS/USDT
The trendline resistance breakout and retest on the weekly timeframe is almost complete. Expecting a big move in the incoming days. Not financial advice. Do your own research (DYOR).

EOS-USDT / 4H / TECHNICAL ANALYSISBINANCE:EOSUSDT "I have indicated my targets on the chart."
Like and comment if you find value in our analysis.
Feel free to post your ideas and questions at the comments section.
Good luck

Eos/USDT Looks Promising for the Mid-TermI have a positive outlook on the price of Eos/USDT in the coming days. If you are someone who enjoys trading the spot market and possess the patience to hold onto positions, now would be a good time to consider holding
Eos/USDT.
Please note that this statement is not intended as financial advice. It is crucial to conduct your own research (DYOR) before making any investment decisions.

EOS to over 50usd price targetTextbook - bullish butterfly harmonic pattern. EOS price target over 50 usd, in best case of scenario.
What may boost price growth:
1. Huge upgrades coming in 2024
2. Recently launched RAM core token to empower EOS ecosystem, a highly scarce token that takes EOS out of circulation.
3. Recently launched stable coins platform, issuance would require taking EOS out of circulation.

EOSUSD - Falling Wedge Possibility EOS has undergone some strong bearish action
Right now it has reached a strong horizontal bottom while being within a falling wedge in green
This falling wedge has the possibility to act bullishly and recover the losses that are evident.

Big pump for EOSThis is a unique situation. After 770 days, the price has reached above the average of the last 400 days. First, we will attack the $1.2 resistance. Then we reach the resistance of 3 and 4 dollars and that is the end of the upward movement

Full-fledged uptrend begins: above 1.870Hello traders!
If you "Follow" us, you can always get new information quickly.
Please also click “Boost”.
Have a good day.
-------------------------------------
(EOSUSDT chart)
The biggest drawback of EOS is that it failed to expand the coin ecosystem.
If the existing community is functioning properly, I think there is a possibility of maintaining the current coin ecosystem.
However, since it is unlikely that additional tokens will be issued to networks that fail to expand the coin ecosystem, it is expected that the coin ecosystem will gradually decrease.
It is necessary to confirm whether there are any moves by the foundation to expand the EOS coin ecosystem in the future.
(1M charts)
In order to see a full-fledged upward trend, I think the price must rise above the MS-Signal indicator and maintain the price.
However, since the currently formed box range is between 1.870 and 40169, the key is whether it can rise above 1.870 unless the box range is formed again.
(1W chart)
In order to rise from the bottom, the price needs to rise above at least 1.331 and hold there.
Accordingly, the key is whether it can receive support above 0.842 and rise above 1.003.
(1D chart)
From a short-term perspective (1D), a volume profile section is formed at point 1.1.
Accordingly, the key is whether the price can be maintained by rising above 1.003-1.1.
As explained in the 1M chart, it is expected that it will completely break out of the bottom zone only if it rises above the 1.870 point, and there is a possibility that a full-fledged upward trend will begin.
If it falls below 0.763, there is a high possibility of entering the bottom again, so caution is required when trading.
--------------------------------------------------
- The big picture
The full-fledged upward trend is expected to begin when the price rises above 29K.
This is the section expected to be touched in the next bull market, 81K-95K.
-------------------------------------------------- -------------------------------------------
** All explanations are for reference only and do not guarantee profit or loss in investment.
** Trading volume is displayed as a candle body based on 10EMA.
How to display (in order from darkest to darkest)
More than 3 times the trading volume of 10EMA > 2.5 times > 2.0 times > 1.25 times > Trading volume below 10EMA
** Even if you know other people’s know-how, it takes a considerable amount of time to make it your own.
** This chart was created using my know-how.
---------------------------------

EOS/USDT successful reclaim and breakout from a key resistance.💎 EOS has been a notable focus in the financial market, recently showcasing a successful reclaim and breakout from a key resistance area. Past instances saw EOS undergoing false breakouts, but the current situation appears to be a valid breakout. This development suggests a strong likelihood of significant upward movement, with the probability next target being the bearish OB area.
💎 However, should EOS retreat to the retesting phase and fail to sustain above the support level, which previously acted as resistance, it could indicate another false breakout. Such a scenario might result in EOS reverting back to the demand area.
💎 In the demand zone, a robust response is crucial for EOS. If it fails to demonstrate a significant bounce from this area, there's a risk of breaking down further. This could indicate a shift back to a bearish trend for EOS, potentially leading to a descent towards a stronger support area.

EOS/USD Anticipating a Bullish Turn from Key Support? 👀 🚀EOS💎 Paradisers, let’s zoom in on #EOSUSDT as it’s prepping for a potentially rewarding phase. Currently anchoring at a crucial support level, it is showing signs of a forthcoming bullish move.
💎 Observing #EOS recent performance, it’s maintaining strong momentum above the EMA. If this momentum persists and it continues to hold firm at the key support level of $.0730, we might be in for a bullish ride. A successful hold above this level could see #EOS making strides towards challenging a robust resistance. Overcoming this could further enhance the likelihood of countering the bearish Order Block (OB).
💎 However, in the fluid realm of crypto trading, #EOS traders need to be ready for different market scenarios. If it faces difficulties in maintaining its ground above the $.0730 support, a recalibration of strategy might be in order. This could mean gearing up for a bullish recovery from a lower support at $0.635.
💎 Should #EOS dip below this $0.635 support level, it might suggest a tilt towards bearish market sentiments, potentially leading to an extended downward movement.

EOS my first big targetIf we look at weekly timeframe, EOS already broken falling wedge pattern
profit target from this pattern is very far at 1.925
but we also have fibonacci 50% at 1.222 as previous resistance
At daily timeframe, NYSE:EOS also perform a nice and strong channel up pattern
target from this pattern at channel up resistance, around 0.923
If we look at hourly timeframe, eos also perform a very trong bullish with curvey wave
nearest target for eos at previous high at 0.843

#EOSUSDT #EOSBTC #EOS $EOS LONG SETUPThere are 175 days to Halving and day by day we are getting close to Halving.
I belive this turtle will start to move over and over, and once day will hit to up side very hard style and nobody belive to its price rising :))
