Smart Money Sell Setup on Gold (15-Min TF)# Smart Money Sell Setup on Gold (15-Min TF)
### 🔍 Market Context:
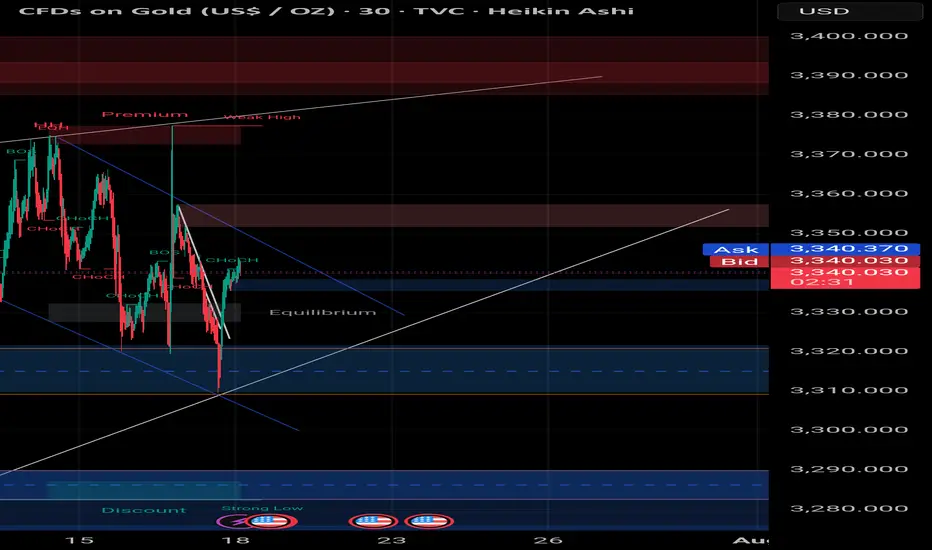
Gold has recently formed a strong bullish retracement after a sharp impulsive bearish move. Now, price has returned to a critical zone — the **Equilibrium level (EQ)** — which also aligns with a **valid supply zone** and **bearish trendline resistance**.
This zone is often considered the "decision point" where Smart Money evaluates whether to continue upward or resume the previous bearish trend.
---
## 📉 Strategy: Sell Limit Based on Structure + Liquidity
### ✅ Entry Zone:
**3341.500 – 3343.000**
(At the EQ zone + premium pricing area)
### 🛑 Stop Loss:
**Above 3345.000**
(Just beyond the last liquidity wick and top of supply)
### 🎯 Take Profit Targets:
- **TP1:** 3338.000 → First demand zone
- **TP2:** 3332.500 → Liquidity sweep target under previous lows
### 📐 Risk to Reward Ratio:
**1:3 or higher**, depending on execution precision.
---
## 🔎 Confluences Supporting the Setup:
| Factor | Confirmation |
|--------|--------------|
| EQ Zone (50% of previous move) | ✅ |
| Supply Zone | ✅ |
| Bearish Trendline Resistance | ✅ |
| Liquidity above EQ | ✅ |
| CHoCH + BOS (Market Structure Shift) | ✅ |
---
## 🧠 Why This Setup Works:
This is a classic **"Premium Price Rejection"** in a bearish environment, combining:
- Institutional logic (EQ level)
- Structural resistance (previous BOS)
- Liquidity traps above
---
## 🧵 Summary:
- **Sell Limit:** 3341.5 – 3343
- **SL:** 3345
- **TP1:** 3338
- **TP2:** 3332.5
- **RR:** 1:3+
- **Style:** Smart Money / Liquidity + Structure Based
---
🔔 **Disclaimer:** This is not financial advice. Always do your own analysis and manage risk accordingly.
#gold #XAUUSD #smartmoney #tradingview #liquidity #supplydemand #priceaction #forex #structure
Equilibrium
All I have to say about ONDO is 'own it!'ONDO has an incredibly bright future, and people are going to regret not owning it on a level rivaled only by Bitcoin.
Good luck, and always use a stop-loss!

XRP is looking like it may trade back to the equilibrium zone.XRP has been struggling to gain a significant amount of ground and is, in my opinion, one of the most heavily manipulated cryptos in the entire cryptosphere. That should tell you something about its long-term potential if the powers that be are willing to put so much time and effort into keeping its price suppressed.
Good luck, and always use a stop-loss!

SUI has traded back up the the equilibrium zone.As many of us already know, SUI has the ability to make some really big moves very quickly, and it's currently trading at the bottom of the equilibrium zone.
This will be very interesting to watch.
Good luck, and always use a stop-loss!

Looking for shorts on EUR/USD on pullback from previous EU seshLooking for a retrace, new liq. sweep that will make an nice order block then enter on BOS confirmation. These confluences will give a solid short position with a nice 2R with a good stop buffer and previous session highs. This draw down is result of bad EU news and the US not cutting the interest rates just yet leading to a strong dollar. These shorts will probably not take out the full move on EUR/USD but this pull back and short is highly likely to play out with the end of the week near. Comment below what you think.

Short on EUR/USD as order block is now being formedWe have a liquidity sweep and order block forming on the upside. As we look for the break below equilibrium and a full break of structure we will short and target previous lower levels of liquidity. Keep in mind news is strong this week with FOMC on wed. and Unemployment on Thur.

XRP Weekly-Monthly Analysis / Retracement Levels for BuyWeekly - Monthly trend: Bearish
Chart Pattern: Head & Shoulders (H&S) - Continuation Pattern
Retracement Fib Price Levels:
0.00% (3.4000)
23.60% (2.6879)
38.20% (2.2474)
50.00% (1.8914)
61.80% (1.5353)
78.60% (1.0284)
100.00% (0.3827)
Good prices for buy:
61.80% (1.5353) – Golden Zone / Golden Pocket
78.60% (1.0284) – Entry Zone
Between 78.60% (1.0284) and 100.00% (0.3827) is the Risk Zone, which we have the Neckline of the ‘’ Quadruple Bottom Pattern ‘’ at the price range ‘’ 0.6291 – 0.7850 ‘’

Technical Analysis of XAUUSD (Gold/USD) – 4H ChartTechnical Analysis of XAUUSD (Gold/USD) – 4H Chart
1. Review of Last Week’s Trend
Strong Uptrend: Gold prices have been steadily rising over the past week, particularly after breaking the structure (BOS) and confirming bullish pressure.
Breaking Resistance Levels: The price has moved above the equilibrium level and the PDL (Previous Day Low), approaching the premium zone.
Resistance at 2800 - 2820: The red zone (Premium) indicates a strong resistance area where the price has reacted and formed a weak high.
2. Forecast for the Upcoming Week
Possible Price Correction: Since the price has reached a strong resistance level (red zone), a potential pullback may occur. The PDH (Previous Day High) could act as support.
Key Support Levels:
PWH (Previous Week High)
2760 (aligned with the white moving average)
2740 - 2725 (aligned with the green and yellow moving averages)
Two Possible Scenarios for Next Week:
If the price breaks above the 2820 resistance: The uptrend may continue towards 2840 and 2850.
If the price fails to break resistance: A correction towards the mentioned support zones is likely.
3. Impact of News on Gold
Trump’s Policies & Geopolitical Tensions: The U.S. warning to Iran regarding Trump could increase market uncertainty, which generally benefits gold.
Inflation Expectations & Fed Policies: Any signs of potential rate cuts by the Federal Reserve could further boost gold prices.
Economic Data: The release of U.S. employment and inflation data in the upcoming week could significantly impact gold’s movement.
Conclusion:
✅ The overall trend remains bullish, but a pullback from the 2820-2800 resistance zone is possible.
✅ Key support levels are 2760, 2740, and 2725.
✅ A breakout above 2820 could push prices towards 2850.
✅ Economic and geopolitical news will play a crucial role in price action.

Complete analysis - shooortS&P 500
Bias:
• Weekly – Uptrend
• Daily – Downtrend
• 4H – Uptrend
• 1H – Uptrend
Fair Value Gap’s.
• 5,740 – 5,830 on the daily
• 6,038 – 5,934 on the daily, filled in by last candle
• 5,979 – 6,016 on the 2H, (23 Dec 15.30 – 24 Dec 11.30)
Order Block:
• 6,037 – 6,063 on the 1H, (17 Dec 15.30 – 18 Dec 11.30)
• 5,892 – 5,840 on the 30M (19 dec 15.30 – 20 Dec 09.30)
Liquidity pool:
• 5,700
• 5,854 (Got hit at 09.30 and Bullishly swept from 09.50 ending in a Premium short with the use of Equilibrium at 12.00)
• 6,102
I think we are going to se it draw back in to the FVG that the last three 2H candles created before then testing the Order Block at 6,037 – 6,063 and procced to hunt the liquidity laying at 6,103 since it’s on a bullish rally on the daily since 20 Dec after hitting Liquidity laying there.
Before dipping all the way down to the FVG at 5,740 – 5,830.
And I think it will go on to the Premium buy side since the market would probably want to hit the Liquidity laying at 5,700.
Though I really doubt it is going to hit that since we are in an weekly uptrend.
From the previous reactions of all the building block I showed it seems it will still follow the same pattern if not any news shows up, I have showed prices reacting of previously named building blocks and then proceeded to predict it next moves based on that the market will continue that pattern.
Ideally the best entry for a short would in my opinion be at 6,102 and above after seeing a break of structure to the downside at the 15M chart.
I am pretty new to this so would love any feedback. You don’t agree with the analysis? Then please comment why so I could see you’re resoning.

A lot of green signals in my eyes.Here i have placed 4 Fair value gap's (Purple rectangle) where 1 is already hit pefectly by that way it dip in to Equilibrium and bought at a premium price and it has responded just perfect of that for the rest of my prediction.
Now, there are three pretty good Fair value gap's above, that market want's to reach so it can fill orders / Price ranges where it lacks liquidiy.
Also we can se 6 Liquidity spots (Blue lines), where as 1 is under current market position (Will talk about that one soon). So market is obviously atracted to those prices so it can get some good liquidiy.
And so when there is some decent looking Fair value gap's and there even is liquidty to get at those levels it is almost inevidable in my eyes that prices doesn't go up there.
So even if the market would want to dip to a price of 2,550 perhaps because of the liquidity laying there it would firstly need to get all the liquidity laying above plus the fair value gaps that the market wants to fullfill.
And the order blocks (red circle's) shows prices were filled at that level previously and just adds to the reason of price wanting to go up.
(Daily chart)
I am not the best at frasing myself, so sorry if it is a bit messy.
Would love to hear feedback! Even just a thumbs down or up!


Premium & Discount Price Delivery in Institutional TradingGreetings Traders!
In today's educational video, we will delve into the concepts of premium and discount price delivery. The objective is to provide you with a comprehensive understanding of institutional-level market mechanics. Before we proceed, it is crucial to define what we mean by "institutional level" and "smart money," as these terms are often misunderstood. We will also address the common misconceptions about who the liquidity providers are in the market.
By grasping these foundational concepts, you will gain a new perspective on the market, realizing that its movements are not random but calculated and precise, orchestrated by well-informed entities often referred to as smart money.
If you have any questions, please leave them in the comment section below.
Best Regards,
The_Architect

PEPE is prepping somethingPEPE is on the 4h charts in an EQ and can go both ways. We want to see a breakout with volume before jumping into the action. The TT is the recent ATH where it will trigger the stop losses and could correct to the GP or even 0.786 fib range.
The liquidity is just below the EQ and just above the recent ATH. A stop loss hunt to 0.0137 can be expected before we go up.

RDDT shortLooking at reddit for lower prices. Distribution model in progress. would be invalidated above 44$

XLV is in tight equilibrium; will break soonAMEX:XLV has formed a five-week equilibrium. The price contraction is already quite tight, indicating that this equilibrium could break very soon. The context is highly bullish: the XLV price is on a weekly uptrend, and the broader market is also showing strong performance. The odds are in favor of an upside breakout.
On the chart, there is an example of a possible trade. Please note that while I’m not a fan of diagonal levels, I’ve drawn the triangle solely to illustrate the idea of equilibrium
Disclaimer
I don't give trading or investing advice, just sharing my thoughts.

Why You Should Avoid Trading Standard Patterns: Deeper AnalysisTrading based on technical analysis is a popular way for traders to identify market opportunities. One of the most common methods of technical analysis is the use of chart patterns. These patterns are recognizable formations created by price movements on a chart.
Traders use these patterns to identify potential areas of support and resistance, as well as trend reversals. However, there are several reasons why you should avoid trading standard patterns:
1. Widespread Awareness and Anticipation:
Standard patterns are well-known and widely anticipated by market participants. This means that they are already priced in, making trading them a low-probability strategy.
2. Potential for False Signals:
The formation of a pattern on a chart does not guarantee the expected outcome. In fact, standard patterns can often lead to false breakouts and failed trades.
3. Difficulty in Trading Effectively:
Trading standard patterns effectively requires a high level of skill and experience. Without a deep understanding of market structure and price behavior, traders can easily fall victim to false signals and whipsaws.
Advantages of Trading Liquidity Patterns:
Liquidity patterns offer a more effective and reliable alternative to standard patterns. These patterns are based on the concept of market liquidity, which refers to the ease with which an asset can be bought or sold without impacting its price. By identifying areas of high and low liquidity, traders can gain an edge in the market.
In-depth Analysis of Popular Patterns:
1. Double Bottom:
The classic double bottom pattern is a bullish reversal pattern that forms when the price of an asset makes two consecutive lows at the same level, followed by a rally.
However, the standard double bottom pattern has a significant drawback: it leaves liquidity below the lows, which can lead to false breakouts and failed trades.
A more effective way to trade this pattern is to look for a lower low. This occurs when the price makes a new low below the previous two lows. This indicates that the market is absorbing all the sell liquidity and is ready to move higher.
2. Triangle:
A triangle is a consolidation pattern that forms when the price of an asset ranges between two converging trendlines.
Traders often look for breakout trades in triangles, but this can be risky.
False breakouts are a common occurrence in triangle patterns.
This is because market makers often manipulate the price to induce traders to break out of the pattern, only to reverse the price and trap them in losing trades.
A more effective way to trade triangles is to look for liquidity grabs. This occurs when the price moves outside of the triangle, only to quickly return back inside. This indicates that market makers are taking liquidity from the market and are preparing to move the price in the opposite direction.
Practical Tips for Trading Liquidity Patterns:
Always trade with the trend. Liquidity patterns are most effective when they are traded in the direction of the overall trend.
Use stop-loss orders to protect your downside. This will help to limit your losses if the trade does not go your way.
Be patient and wait for the right setup. Don't force trades and only take those that meet your criteria.
Additional Considerations:
Market context: It is important to consider the overall market context when trading liquidity patterns. For example, patterns are more likely to be successful in trending markets than in range-bound markets.
Risk management : Always use sound risk management principles when trading, regardless of the pattern you are using. This includes using stop-loss orders and position sizing appropriately.
False signals: It is important to be aware of the potential for false signals when trading liquidity patterns. Not all patterns will lead to successful trades, and it is important to be prepared for losses.

HTF perspective of EURUSDAt the time being the market is internally bearish so we could aim for the price to come into the demand area of the extreme of the bullish structure.
With that said at the time being, the price is showing indecision, after mitigating an area of weak demand.
However, the price is at an equilibrium area and could be forming a new swing higher low to reach higher highs. conversely, I am more willing to aim for lower prices in strong demand areas before aiming for higher highs on EURUSD

IPDAUsing IPDA, implied dealing range, Premium / Discount, Seasonality, and a Breaker to anticipate NQ's delivery over the course of the coming months.

MSFT Reaches Equilibrium within Its DowntrendPrimary Chart: Weekly Chart of MSFT Showing Down Trendline, 200-Week SMA, Key VWAPs and Fibonacci Levels
Microsoft Reaches a State of Equilibrium within Its Downtrend
Equilibrium means "a state of balance." Equilibrium has been reached precisely because MSFT is holding above long-term support, and below its primary downtrend resistance levels. It also has been acting bullishly (the failed breakdown today already discussed). SPX remains in a very tight triangle pattern, and this likely resolves soon (as the apex is approaching rapidly), perhaps after the February 1, 2023 FOMC. MSFT will likely follow suit with whatever direction SPX takes after that key decision. Markets seem to be interpreting every bit of news bullishly at the moment, giving even negative headline a positive spin. This should not be surprising, as markets do whatever they want, and this favors technical analysis. So markets may continue fighting the Fed even if nothing new is stated at the FOMC presser on February 1, 2023.
SquishTrade will briefly summarize key technical points concerning Microsoft Corporation NASDAQ:MSFT . This firm reported earnings yesterday after the closing bell. Initially, the stock popped vigorously on what appeared to be earnings that were not as bad as feared. But when it gave guidance on its earnings call, the firm fell just as violently. During trade today, however, the forces buoying markets helped MSFT recover back above its uptrend line that runs from early January 2023 lows. This "failed breakdown" is short-term bullish from a technical perspective.
Upside price targets have a lot of obstacles in their path given that the primary-degree downtrend remains intact from all-time highs in late 2021. Thus, any upside price target should be viewed as tenuous and conditional on substantial further progress in major indices (SPX / NDX). Upside price targets include two alternative Fibonacci and measured-move projections as well as major resistance from previous swing highs (blue rectangle) and down trendline resistance. Downside support remains at the 200-week SMA as well as the uptrend line off 2022 lows (dark blue).
Conditional upside price targets
1. If SPX breaks its triangle pattern (approaching its apex now) to the downside, upside price targets should be invalidated. The FOMC presser on February 1, 2023, may be a critical turning point for markets.
2. Provided markets continue pushing higher, with pivot-hopeful stocks leading the way, and provide SPX breaks above its triangle pattern even if only for a few weeks, MSFT can reach $254.67 (which it reached after hours yesterday after the earnings report), and the 200-day SMA also aligns with this level (not shown) as of today. The down TL also lies near this area. If the downtrend line is broken convincingly, $261-$263 can be considered a more aggressive upside target, with the most aggressive target around $270-$273.
3. Downside support remains at the blue uptrend line from 2022 lows. Shorter-term support at the parallel channel from January 6, 2023, lows is also important. This support held despite a volatile whipsaw below it today after earnings were reported.
Importantly, this post does not intend to imply that the Fed will pivot. No one knows when that happens, and the Fed has been stating that it intends to keep rates higher for longer, above 5% for all of this year. But mention of a pause by the Fed, or a discussion of a pause by the voting members, can fuel further rallies especially in technology stocks by participants who perceive this (perhaps incorrectly) as a pivot.
Summary of key technical evidence :
MSFT's weekly chart shows MSFT holding above an upward sloping 200-week SMA after piercing this long-term MA a couple of times.
But the down TL from MSFT's all-time high remains intact. In fact, MSFT's down TL has not been attacked the way that SPX and NDX's down trendlines have been in recent weeks.
Key VWAPs from all-time highs and from mid-August 2022 highs remain intact as well. The mid-August 2022 VWAP was resistance today, though barely so. The VWAP from the lows of 2022 was recovered today after a failed breakdown below it after earnings yesterday.
MSFT has been forming higher lows (and higher highs) since its low in 2022. An uptrend line can be drawn from the October 2022 low to the present price bar.
MSFT's candle this week has formed a doji—a technical signal of indecision (and equilibrium between buyers and sellers). This has followed large moves up and down in volatile trade after earnings were reported this week.
MSFT experienced a failed breakdown below recent support and the shorter-term uptrend channel after earnings. This is short-term bullish suggesting the possibility of further upside.
A major horizontal zone of resistance from 260-270 has rejected price firmly since late August 2022.
MSFT may follow the direction SPX takes out of its consolidation triangle, where price is rapidly nearing the triangle's apex.
Additional Charts
Supplementary Chart A
Notice how MSFT's price reclaimed the VWAP from the November 2021 low. That seems bullish. But it also failed at the anchored VWAP from the August 2021 high. That seems weak. This is yet additional evidence of the equilibrium between buyers and sellers, perhaps waiting to see if the Fed remains hawkish or if markets rally no matter what the Fed says, because the market has resolutely refusing to believe the Fed's dot plot anyway.
Supplementary Chart B
Notice this logarithmic linear regression channel's upper edge (+2 standard deviations) coincides with the downward trendline from the 2021 peaks as well as with the major area of resistance / supply (the blue rectangle shown).
Concluding Comments
Lastly, SquishTrade will address a few issues relating to the forces that appear to be at work as equities, including MSFT, rise higher despite bad news. It appears that markets are eagerly anticipating a Federal Reserve pivot or pause of some sort in the near future. There is some disconnect between what the Fed has said and what markets believe. Markets have priced in rate cuts later this year in fact, and the Fed's dot plot from the most recent FOMC meeting shows 5.1% as the terminal rate to be held throughout the entirety of 2023 with *no cuts anticipated.* Many believe that this Fed approach will soon change, as reflected by equity prices and Fed Fund futures pricing in rate cuts. Further, FOMO, combined with short covering, and CTAs that trade strictly with momentum in whatever direction, have driven prices near mid-December 2022 highs in the indices.
Disinflationary trends have caused investors to believe that inflation is history. While inflation may have reached its peak, certainty about whether it will return to the Federal Reserve's target of 2% remains elusive. Will sticky inflation keep monetary policy tight for the remainder of the year? Will the market be proved wrong and ultimately decline to new lows because the Fed's view is right and the markets are fighting the Fed? Will the Federal Reserve pause hikes and hold rates higher for longer until more evidence appears that inflation is well on its way to the target?
No one knows the answers to these questions, but they are relevant to what is happening in markets right now. If the market is wrong about inflation quickly returning to the Fed's target, or if the market is wrong about a "soft landing" (earnings and the economy not falling into a major downturn), then markets will quickly and viciously reach new lows. Until these become more apparent, expect prices to remain buoyed in MSFT and other major names.
Thank you for reading, and Happy New Year / Feliz Año Nuevo!
________________________________________
Author's Comment: Thank you for reviewing this post and considering its charts and analysis. The author welcomes comments, discussion and debate (respectfully presented) in the comment section. Shared charts are especially helpful to support any opposing or alternative view. This article is intended to present an unbiased, technical view of the security or tradable risk asset discussed.
Please note further that this technical-analysis viewpoint is short-term in nature. This is not a trade recommendation but a technical-analysis overview and commentary with levels to watch for the near term. This technical-analysis viewpoint could change at a moment's notice should price move beyond a level of invalidation. Further, proper risk-management techniques are vital to trading success. And countertrend or mean-reversion trading, e.g., trading a rally in a bear market, is lower probability and is tricky and challenging even for the most experienced traders.
DISCLAIMER: This post contains commentary published solely for educational and informational purposes. This post's content (and any content available through links in this post) and its views do not constitute financial advice or an investment or trading recommendation, and they do not account for readers' personal financial circumstances, or their investing or trading objectives, time frame, and risk tolerance. Readers should perform their own due diligence, and consult a qualified financial adviser or other investment / financial professional before entering any trade, investment or other transaction.

DXY Testing the Equilibrium on the Daily. On the daily time frame, we see DXY has respected the Equilibrium, instead of breaking through it, it has bounced off and turned back towards the upside.
This confirms the two scenarios, well actually three scenario cases.
First Scenario: Price is ready to run with the bulls and we see stronger pullbacks to the upside, higher highs, and higher lows back toward the premium.
This would mean the Dollar gains strength, a possible break into EQ (103.46- 102.74) before reversal back towards premium.
Second Scenario: Price is ready to drop with bears and we see a stronger push through Equilibrium, breaking 102.74 and heading towards the discount.
This would mean the Dollar would continue to weaken.
Third Scenario: Possible consolidation around (102.74-103.46) area as it is a key zone which could mean the price could hang around for a few days deciding which way to go.
This would mean the Dollar would go sideways not breaking too high or low for a few days.
Goal: Catch the trend of the dollar strength when trading the other pairs. If it's going up we are buying, If it is going down we are selling.
My Plan: If it respects equilibrium wait for a breakout to the upside, then set a pending order for a buy to the next level of interest with SL below equilibrium.
If it enters the equilibrium wait for it to touch the bottom and see if respects it, set a pending buy order at the top of the equilibrium with sl at the bottom.
if it breaks through it, set a pending sell order at the bottom of the equilibrium with sl at the top.
If it breaks the equilibrium wait for a breakout to the downside, then set a pending order for a sell to the next level of interest with sl above equilibrium.
Outlook: This could take some time to form as this is a key area for the Dollar right now. Be patient, and set alerts for the zone.

Weekly Review (Ending 123022)This past week was the last week of trading for the year and man, did it feel like it. The first two days of the week, Tues. and Wed., were clean. I noted earlier in the week that I wanted to see 3780 as an objective but, after being wrong analysis, the Daily Time Frame told a different story. It is at Equilibrium, which Price is likely to consolidate. So, with it being the last trading week of the year and Price being at Equilibrium, It was more likely for Price to have a Consolidation Weekly Profile.
Green Check = Correct Bias
Red X = Wrong Bias
Grey Circle = No Bias/Did not trade/Neutral

SBB BWe're currently close to the middle and I closed my positions. The price has no clear direction of where it's gonna go now, so now I will wait until we either move up to look for sales, or move down to look for buys.

RSR squiggly working out - back down to EQJust an update from previous post since I cannot post an update photo, but we followed the squiggly nicely and the idea is now reached.
Will update thoughts again soon!
