Positive risk tone sees JPY and CHF lead to the downsideHeading into today’s European trading session, the risk tone is leaning risk on with Asia-Pacific indices mostly positive, measures of volatility subdued and safe havens pressured.
In the FX complex, the positive risk tone sees JPY sit at the bottom of the F majors, followed closely by CHF with USDJPY set to test the 109.00 handle to the upside, while NZDJPY reclaimed the 76.00 handle.
Indeed, the antipodeans are currently leading the FX majors to the upside; although it’s AUD sitting in pole position, but NZD a close second. All in all, however, it’s worth noting that most currency pairs have remained contained by recent ranges, with no significant developments or catalysts observed throughout the Asia-Pacific session.
Looking to the sessions ahead, expect central banks to once again be a key theme for the day. The SNB will announce their latest policy decision early in the European session, while central bank speakers from numerous central banks are scheduled to speak throughout the day.
Equity

S&P500 at 4,100 as a 'base case' this year - RBCRBC discussed its S&P500 expectations for 2021 in a recent note to clients.
RBC noted:
Our 2021 S&P 500 target of 4.100 is our base case. It is roughly the median of 15 upside scenarios that we examined. If our call proves too conservative, our analysis suggests that the S&P 500 could trade as high as 4,600 for a +20% full year gain - the most bullish scenarios we examined came close to this level.
Among the eight downside scenarios we examined, which articulate our bear case for full year or interim downside if momentum breaks lower, several point to a pullback to the 3600 / 3700 area (mid single digit drop in percentage terms depending on the starting point used) or to -3,200 (mid to high teens dip in percentage terms depending on starting point).

S&P Ranging, Looking to BreakoutStocks retraced and are correcting sideways. We had a fairly risk-off/neutral day yesterday. The level 3890, or the 0.618 Fibonacci level is definitely providing some support right now and seems to be a lower bound for now. The Kovach OBV is trending up but has flatlined slightly. It could go either way from here. Further retracement could easily take us to the 50% Fibonacci level if 3890 does not hold. A breakout could take us to relative highs at 3987. We are maintaining a pretty narrow range at this point suggesting that stocks are ready for a breakout either way.

Stocks Slump Amid Virus WoesStocks are struggling, and it appears virus woes may be putting a damper on them. The S&P made a run for 3963, but fell just short of this and retraced back down to 3933 or so, which is a Fibonacci and technical level. We should see support here, but if not, 3890 would definitely provide support. We will find further support at 3860 or so. The Kovach OBV is rounding off suggesting that we may be in for more bearish momentum, or at least some sideways trading before momentum comes through to attempt highs at 3987.

Stocks Pull Back on Geopolitcal TensionsStocks retraced in the Asia-Pacific session due to geopolitical tensions in Myanmar and Turkey, to the 0.618 Fibonacci level, anchored at the relative high at 3987, and the low of our head and shoulders from which we saw the breakout at 3733. We are getting good support from this level but further fallout could take us to 3860, which would be a 0.500 Fib retracement. The Kovach OBV is receding a bit, but not to extremes. Thus it is likely we will find support at one of these Fib levels. We will face resistance from 3933 first, then highs at 3987.

RMO: Nice bullish correction in progress!RMO has been picking up some steam. Made what looks like an impulse, and now it is correcting. I'm very bullish on this! Will this develop into a flat, or just a simple zag?

Stocks Finally Retrace!!We finally got our correction in stocks that we have been anticipating for two days now. The S&P has retraced to 3909, which was one of the levels we've called out. If this correction is not finished, a healthy retracement could take us to 3887 or 3848. The Kovach OBV has barely dipped. A burst of momentum would have to take us to 3978 first, before highs at 4009.

Stocks Continue to RangeStocks have continued to range, stubbornly refusing our prediction of a breakdown. However the longer they range the higher the probability of a breakout or breakdown. If we see a breakdown, watch 3907 or 3886 for support. If we breakout, the immediate target is 4009. The Kovach OBV is still strong here, suggesting the momentum is there, so it really could go either way at this point.

$JSESTXPRO Satrix Property ETF. Second target within reachAfter a very bullish looking flag breakout around the 780 level the first target was reached on this share. The second target around the 916 level is within reach today. I'm expecting some consolidation around the the 920-930 levels after which I will reevaluate. Property have got a lot of upside potential after a few years of dismal performance. One to continue to watch into the future.

$JSENRP Nepi Rockcastle. Upper channel break and retestNepi broke out of a bullish looking flag formation and has pulled back to test the support level of this pattern today. If this level hold, it will be a bullish signal with an upper target around the 13000 level.

$JSELEW Lewis. Second target within reachAfter a period of consolidation between 2500 and 2200 this share finally broke from this pattern, reached the first target and then retested the breakout level. The second target for this pattern is now within reach around the 3050 level.

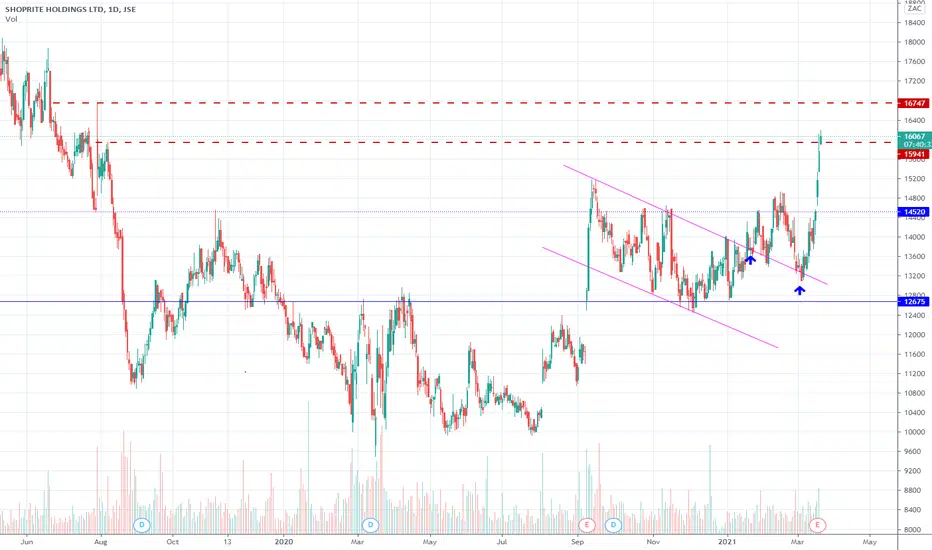
$JSESHP Shoprite Bull flag targetAfter the bull flag break at around the 13800 the flag was tested twice. The last test was around the 13100 level before a very powerful move to the first target of 16083. That level has now been reached. A second target for this flag pattern around the 16750 level remains.
$JSEKAP KAP Industrial Holdings. Cup and handle breakAfter the cup and handle neckline break of 342, the first target of 443 was reached. Currently it's looking like it's consolidating a bit at this level and getting ready for a move to the next target of 500. One option could be to lock in some profit at this level and move your stop loss to the neckline breakout level in anticipation for the next leg up that could take some time to complete.

Retracement Near for Stocks?Stocks are bullish, but their trajectory is waning. The Kovach OBV is still strong but has been leveling off. This is usually an indication that we will get a retracement soon. The level 3738 seems to be providing some resistance and we won't be able to break through without some significant momentum. If we can, the 4000's are in sight and 4009 is the next target. A retracement here could be swift and take us to 3887 or even 3867. The neckline of our inverse head and shoulders should provide further support at 3848.

$JSEMDI Master Drilling Company. Consolidating Master drilling has been consolidating in a flag pattern since the strong move up from 520c levels to 900c levels. A convincing (volume) break above 800c could see this share go to 930c and 978c levels.
Warning: Low liquidity on this share could see some wild swings.

Bull Breakout for the S&P??Stocks are looking pretty bullish lately. There is a clear bull channel and the Kovach OBV is very strong. We appear to be forming a bull wedge consolidation pattern, suggesting that a further breakout could be approaching. If we are right, a breakout could easily take us back to 4000's. If we are wrong we could retrace the entire move and find support at the neckline of our head and shoulders pattern from earlier this month. Further fallout could take us back to the level which constitutes the head of our inverse H&S pattern at 3737.

Short coppercopper has made a double top at 4.12 which i believe is bearish and early next week it will definitely challenge the 4 mark. Because of this i am expecting a drop in s&p to around the 3800 mark some time next week

Best Stock Trading IdeasStocks have broken out of our pseudo-megaphone pattern. We have been alerting you as to this pattern for over a week. We found resistance at 3963, and retraced a bit to 3909. The Kovach OBV is still very strong, and the dip in the chande suggests this may be a buying opportunity here at current levels. If not, we could retraced to 3887 or 3867. Watch for resistance at 3928 and 3927, but otherwise a burst of momentum could take us back to relative highs.

$JSERMI Rand Merchant Investment Holding. Consolidating This share has been stuck in a trading range between 3360 and 2930 for 280 days. A break above 3360 will be quite an achievement and would indicate a target of 3800 to a level where strong resistance could be met. Currently this one is good for a watchlist only.

$JSEDTC Datatec. Slow uptrend recoveryWeekly chart shows a defined uptrend with good support since the COVID selloff last year. Some overhead resistance at around the 3090 level, but slowly moving toward upper resistance around the 3700 levels. Maybe one to consider for the long haul.

$JSEPPE Purple Group. Nice consolidation breakPurple Group broke of of a four month consolidation pattern today. The previous high of 120 looks like a possible target. Warning: Small caps with low liquidity are prone to wild swings at times. Take that into consideration when setting a stop loss. A break back into this consolidation pattern on a daily chart could indicate a consolidation continuation.

TESLA BUY Hi there.
Price is forming a continuation pattern to the upside. Wait for the price to complete the pattern and watch strong price action for buy.

NAS100 - longs running 📈🚀Entry details are shown on the chart.
We're only looking for TP3.
Trade history can be seen below this trade idea too for full transparency.
This isn't one of our main timeframes, but I'll be doing more testing on the H2 chart over the weekend.
------------------------------------------
I try and share as many ideas as I can as and when I have time. My trades are automated so I am not sat in front of a screen daily.
Jumping on random trade ideas 'willy-nilly' on Trading View trying to find that one trade that you can retire from is not a sustainable way to trade. You might get lucky, but it will always end one way.
------------------------------------------
Please hit the 👍 LIKE button if you like my ideas🙏
Also follow my profile, then you will receive a notification whenever I post a trading idea - so you don't miss them. 🙌
No one likes missing out, do they?
Also, see my 'related ideas' below to see more just like this.
Interested in access to my strategy so you can be in these trades the moment they're valid? Drop me a DM .
The stats for this pair are shown below too.
Thank you.
Darren
