Bearish Accumulation on ERDHello, traders.
ERD is forming a Bearish Accumulation pattern called a Bear flag.
A bear flag pattern is constructed by a descending trend or bearish trend, followed by a pause in the trend line or consolidation zone. The strong down move is also called the flagpole while the consolidation is also known as the flag.
The bear flag pattern comes after a strong move downwards. The stronger the movement, the bigger the profit potential is.
After we identify the market trend and the characteristics of an excellent bearish flag pattern, we need to wait for confirmation that the trend is about to resume.
There are two basic approaches to enter the market with the bear flag pattern. Aggressive traders will enter at the top of the bearish flag as this will secure a little bit of more significant profits.
Best regards.
Sando and Gustavo.
ERDBTC

Elrond (ERD) Has More Room To GrowERD is trying to breakout of the falling wedge and if it does, it has definately has more room to grow.

Elrond looking goodPlease feel free to comment or challenge me on my TA. If you like my idea, leave a like to show support.
--------------------------------------------------------------------
- R/S flip on the daily level
- Hidden bullish div on RSI & MACD
- Crossover on the MACD
Targets:
- 218 sats
- 256 sats
SL: 183 sats

ERD seems BULLISH on 4H ERD looks bullish to me on this chart (4H timeframe).
It is ranging on this channel for quite some time now. Some movement should happen very soon. Volume is still important.
Look for this small ascending triangle, if it breaks by the top we might reach the 230 area pretty soon.
Don't forget to wait for the crossing on MACD + RSI consolidation for a better overall view.
As always, this is just my vision, not an investment advice. Good luck everyone! :)

#ERD/BTC TECHNICAL CHART ANALYSIS & PRICE ACTION MOVES#ERD/BTC TECHNICAL CHART ANALYSIS & PRICE ACTION MOVES

Buy at 165 satoshiErd will drop till 165 sats after it will grow so fast till 203 sats. #erd #egld #elrond $erd $egld $elrond BINANCE:ERDBTC


ERDBTC Retracement to 61,8% FIB LevelsGiven what's happening in the market, as well as the fact that we're entering the traditional Bear Market season that starts around August, also the past event of the mainnet launch and the amazing 29x rally that ERD did these past 4 months, a serious retracement is to be expected. There are some resistance levels along the way that I didn't draw on the chart as they are pretty visible. But the writing is on the wall. this is the time to be capitalizing profits and load the buy orders starting under 150 sats, in an organized fashion, with DCA in mind. Don't spend everything at once. :D

ERD/BTC (Bearish Two Lower Highs?)ERD/BTC
-After the price printed two Lower Highs
-It started breaking local support at the moment
-If this candle will fail for the next 12-24 hours
-There is a huge chance of potential previous resistance retest
-Which is located around 183 sat range
-That's still over -15% drop from the current price
-I only recommend opening a Buy position once reversal signs are seen

ERD Elrond Retracement LevelsElrond has now a market cap of 300 000 000 usd with a circulating supply of 13,323,533,427 from a total supply of 20,000,000,000 ERD.
My first target is 97satoshi in the short term.
If you are interested to test some amazing buy and sell indicators, which give the signal at the beginning of the candle, not at the end of it, just leave me a message.

ERD ELROND Rising wedge 4Hr Chart - ERDBTC ERDUSD ERDUSDT ERD ELROND Rising wedge 4Hr Chart - ERDBTC ERDUSD ERDUSDT

ERD making RISING WEDGEERD is ranging between two trend line T1 as resistance and T2 as support.
Resistance has been tested twice at T1 and also support has been tested twice on T2.
ERD Needs to test the daily levels at 187 and have to break for a bull run. Other it is going to retrace back to 161 which is a daily support.
ERD is making RISING WEDGE PATTERN
If we see at the volume, it is decreasing but the price action is respecting the rising wedge, indication that price may fall from rising wedge. The volume needs to increase in order to break the daily level. Otherwise it going to pull back.


ERD/BTC 1h (Binance) Descending channel retestFA: Elrond will be integrated with Swipe services so ERD will be spendable via Swipe Wallet and its associated Visa debit cards.
TA: Price broke-out that parallel channel and pulled-back, this could be a nice scalp opportunity for a bounce.
Current Price= 0.00000163
Buy Entry= 0.00000164 - 0.00000158
Take Profit= 0.00000172 | 0.00000178 | 0.00000188
Stop Loss= 0.00000150
Risk/Reward= 1:1 | 1:1.55 | 1:2.45
Expected Profit= +6.83% | +10.56% | +16.77%
Possible Loss= -6.83%
Fib. Retracement=0.5 | 0.786 | 1.272
Margin Leverage= 1x
Estimated Gain-time= 240h


What is next for ERD?Hello, traders.
What is next for ERD? Technical analysis is knowing how to react to the future price movement. In my view, we are starting a downward channel, but if we break the red line upwards, the chart will look like a bullish flag.
The other scenario we have the possibility of being forming a head and shoulders o pattern at the top of the trend, we have an important level of support in the blue line, and if we break down it would be quite bearish for this asset
When we have so many mixed indications like that, the right thing to do is to stay out
When you in doubt, stay out.
Sandro and Gustavo.

Fibonacci Retrecement buyHello, traders.
I expect a correction to at least the first Fibonacci level, but the ideal would be on a 50% retracement zone. After a sharp rise, a correction is healthy, or at least we can expect a bullish accumulation pattern.
But if the price is above 190, a purchase will be indicated, as it will be breaking the ATH.
Push the like button and follow us on Tradingview.

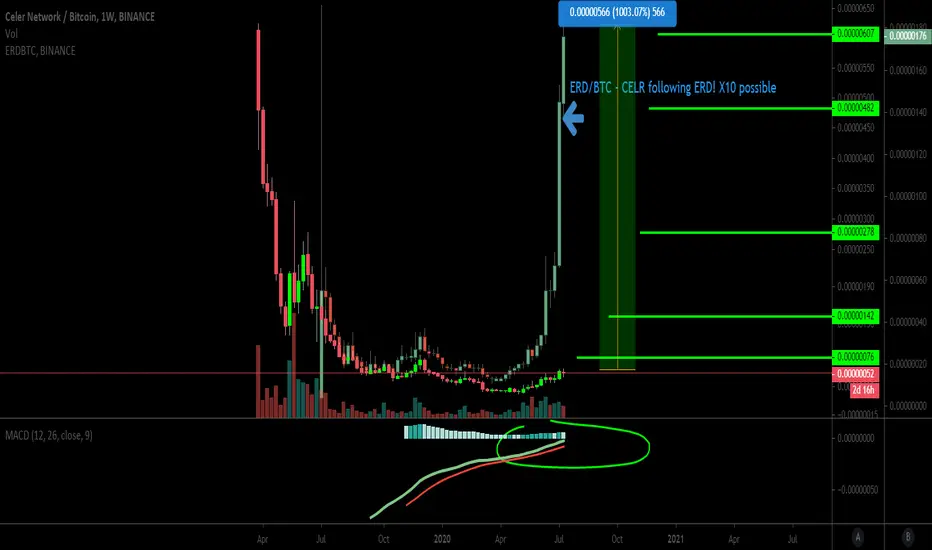
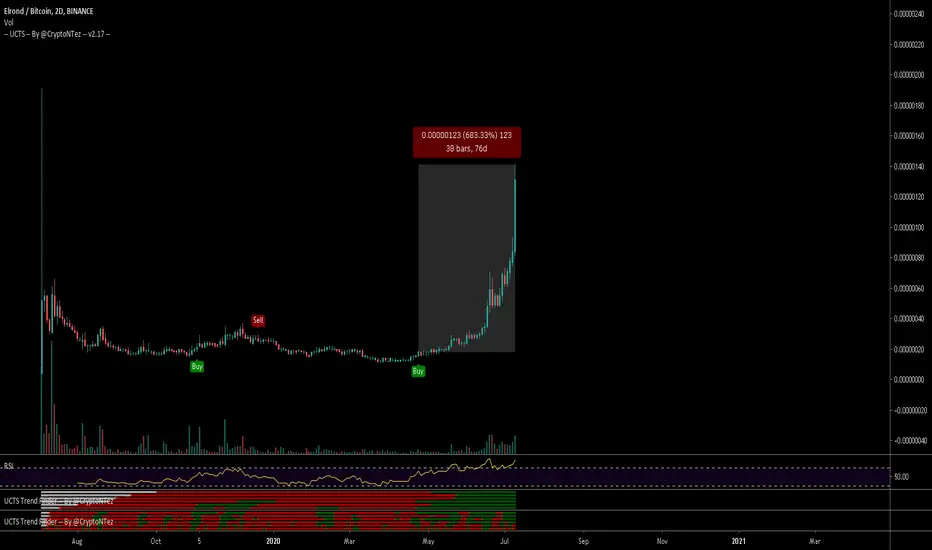
CELR - CELER NETWORK - 1000% GAINS like ELROND ERD/BTCSimple, easy to follow. Buying at market price now and wait to profit!
over X10 in the making.
Buy in Binance!
My opinion, gain with me!
ERD can make new highsAccording to Ichimoku trading system, Elrond has 4 strong bullish signals those are price is above Kijun, the crossover of Kijun and Tenkan has not happened yet so it can be said that price can retrace its patch back to Tenkan which is 0.0158 area and then it will pump again making new highs but there if it closes below Tenkan then it will test 0.015 area on which it is facing another resistance (Kijun) so if it fails to close below Kijun (red line) too. Then there will be a weak signal of short. Another good bearish sign is the price is above the Kumo cloud which is generally considered bullish so total we can say it has 4 resistance to cross Senkau A ( upper border of Kumo cloud), Senkau B (lower border of Kumo cloud), Tenkan (Blue line), Kijun (Redline). If there is a crossover of Kijun (red line) over Tenkan (Blue line) then it will be a weak bearish signal because the price is above the Kumo cloud and if price retraces its path back to Kumo cloud then it will consolidate and we can see a pump or dump. Do share your thoughts in the comments :smiles:

Elrond (ERD) Breaking Out For MoreElrond (ERD) is about to break an important zone. If it can succeed to do so, we will be able to see more upside.

ERD just printed a continuation patternThe price found support at the 80 stats level, which was resistance 2 times in the past.
Right now it broke the descending channel to the upside and therefore confirmed a continuation pattern.

ERDBTCERDBTC - BULLISH!!!
ENTRY: 77-83 sat
TARGET: 89, 100+ sats
STOP: 75 sat
Little price history on BInance, I could expect this coin to go to places we don't expect
