VIX Hits 27-Year Extreme. Is the Market About to CRASH or SOAR?The Volatility Index (VIX displayed by the blue trend-line) has entered a level that has visited only another 5 times in the last 27 years (since August 1998)! That is what we've called the 'VIX Max Panic Resistance Zone'. As the name suggests that indicates ultimate panic for the stock markets, which was fueled by massive sell-offs, leading to extreme volatility and uncertainty.
So the obvious question arises: 'Is this Good or Bad for the market??'
The answer is pretty clear if you look at the chart objectively and with a clear perspective. In 4 out of those 5 times, the S&P500 (SPX) bottomed exactly on the month of the VIX Max Panic signal. It was only during the 2008 U.S. Housing Crisis that VIX hit the Max Panic Zone in October 2008 but bottomed 5 months late in March 2009.
As a result, this is historically a very strong opportunity for a multi-year buy position. If anything, today's VIX situation looks more similar to September 2011 or even the bottom of the previous U.S. - China Trade war in March 2020.
-------------------------------------------------------------------------------
** Please LIKE 👍, FOLLOW ✅, SHARE 🙌 and COMMENT ✍ if you enjoy this idea! Also share your ideas and charts in the comments section below! This is best way to keep it relevant, support us, keep the content here free and allow the idea to reach as many people as possible. **
-------------------------------------------------------------------------------
💸💸💸💸💸💸
👇 👇 👇 👇 👇 👇
S&P 500 E-Mini Futures
S&P500 Vast Support from previous High. New 2 year Bull started.The S&P500 / US500 has reached a bottom and is rebounding.
The rebound is taking place just over the 1week MA200 but also the key pivot line that was previously a Cycle High and now turned Support.
We have seen this another 2 times in the last 10 years and both time caused a massive rally.
This puts an end to the tariff war correction and based on the chart starts a new 2 year Bull Cycle.
Minimum rise before was +58%. Target 7600.
Follow us, like the idea and leave a comment below!!
S&P500: Trump's 90-day tariff pause just saved the day??S&P500 is having so far a +9.50% rise from today's low as even though Trump announced a 125% raise to China tariffs, he lowered and paused tariffs for 90 days to all countries that contacted the U.S. for negotiation. The 1D technical outlook is about to get neutral (RSI = 42.537, MACD = -181.510, ADX = 39.036) as the rebound is taking place at the HL bottom of the Bullish Megaphone, while the 1W MA200 stayed intact.
A similar Megaphone was last seen during the previous 2018 Trade War and was completed with the COVID crash that started an abnormal rally to new ATH to correct the equally abnormal crash. Needless to say, it was based on quick rate cuts but the situation isn't all that different today. Trump's stance towards negotiating, coupled with highly anticipated rate cuts, can deliver an equally abnormal rally now.
The previous HH of the Bullish Megaphone hit the 2.0 Fibonacci extension. This time if the rally extends to the end of the year, targeting the 1.5 - 1.618 Fibonacci Zone would be considered fair (TP = 6,900).
## If you like our free content follow our profile to get more daily ideas. ##
## Comments and likes are greatly appreciated. ##
S&P500 Dead Cat Bounce or V-shaped Recovery?The S&P500 index (SPX) saw a remarkable turnaround yesterday after the Wall Street opening. The early futures sell-off came very close to the 1W MA200 (orange trend-line), which has been the ultimate Support level since the March 2009 Housing Crisis bottom (the last major Bear Cycle).
It supported the 2022 Inflation Crisis, the 2018 U.S. - China Trade War, the 2015 E.U./ Oil Crisis and 2011 correction. It only broke during the irregularity of the March 2020 COVID flash crash.
Note that the 1W RSI hitting 27.30 has only happened during the COVID crash and the actual March 2009 Housing Crisis Bottom. At the same time, the index reached the All Time High (ATH) trend-line (dashed0 of the High before the 2022 Inflation Crisis (previous correction phase). As this chart shows, previous ATH trend-lines have never been broken during the correction phases that followed them.
In any case, the million dollar question is of course this: Was yesterday a Dead Cat Bounce inside the new Bear Cycle or we are ahead of a V-shaped recovery? Well technically it depends on the 1W MA200 (the market needs 1W candles to close above it) while fundamentally if depends on potential trade deals and of course the Fed (the market needs rate cut assurances).
If this is a V-shaped Recovery indeed, there is no reason not to expect the market to follow all previous rebounds of 1W MA200 corrections that weren't Bear Cycles (Bear Cycles on this chart are 2008 and 2022).
As you can see, all rebounds have been sharp, indeed V-shaped recoveries, ranging from 20 to 27 weeks (140 - 189 days) until they broke their previous High. So this indicates that technically, SPX should make new ATH by October 13 2025 the latest (and September 02 earliest). Of course this is just a projection, this time we have no COVID shutdowns, no Grexits or Brexits, no Oil crises, it is all due to one fact, the tariffs and if deals are reached and the Fed delivers the much needed rat cuts, the recovery may be even faster, as sharp as the correction has been.
The facts are on the historic data on the chart. The conclusions are yours.
-------------------------------------------------------------------------------
** Please LIKE 👍, FOLLOW ✅, SHARE 🙌 and COMMENT ✍ if you enjoy this idea! Also share your ideas and charts in the comments section below! This is best way to keep it relevant, support us, keep the content here free and allow the idea to reach as many people as possible. **
-------------------------------------------------------------------------------
💸💸💸💸💸💸
👇 👇 👇 👇 👇 👇
Weekly Market Forecast: Short Term Buys, Then Sells! In this video, we will analyze the S&P 500, NASDAQ, AND DOW JONES Futures for the week of April 7 - 11th.
The Stock Market Indices may find support at current levels for a Bear Market Rally. Wait for the market structure shift to the upside before taking any buys. Let the market confirm it's intended direction first, then look for valid buy setups for a short term countertrend play.
Enjoy!
May profits be upon you.
Leave any questions or comments in the comment section.
I appreciate any feedback from my viewers!
Like and/or subscribe if you want more accurate analysis.
Thank you so much!
Disclaimer:
I do not provide personal investment advice and I am not a qualified licensed investment advisor.
All information found here, including any ideas, opinions, views, predictions, forecasts, commentaries, suggestions, expressed or implied herein, are for informational, entertainment or educational purposes only and should not be construed as personal investment advice. While the information provided is believed to be accurate, it may include errors or inaccuracies.
I will not and cannot be held liable for any actions you take as a result of anything you read here.
Conduct your own due diligence, or consult a licensed financial advisor or broker before making any and all investment decisions. Any investments, trades, speculations, or decisions made on the basis of any information found on this channel, expressed or implied herein, are committed at your own risk, financial or otherwise.
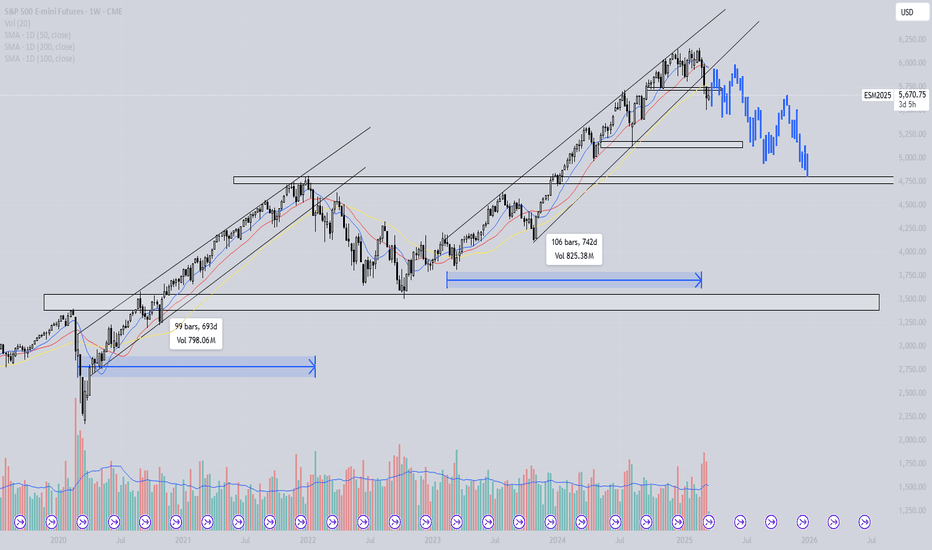
S&P - Will we follow 2020/2021?The S&P has been trading in a rising pattern for over 700 days, similar to the rising pattern observed in 2020 and 2021. In that instance, the price of the S&P broke below the support trendline and lost all SMA support, while also making a lower low. This has not occurred since the start of the current pattern. Could a deeper correction follow?
Blue line = 50-day MA
Red line = 100-day MA
Yellow line = 200-day MA
Analysis of the 2020/2021 Price Action
We can conclude the following five points:
1. The rising wedge lasted for nearly 700 days.
2. The price consistently made higher highs and higher lows.
3. The S&P found support on the SMAs and never broke below the 200-day MA.
4. After approximately 700 days, the S&P broke below the rising wedge, lost all key SMA support, and made a lower low.
5. During the retest of the rising wedge and key SMAs (which had turned into resistance), a bearish cross (50-day SMA below the 100-day SMA) occurred, leading to a downtrend.
How Does the 2020/2021 Price Action Correlate to 2023/2024?
We can conclude the following five points:
1. The rising wedge lasted for approximately 750 days.
2. The price continued making higher highs and higher lows.
3. The S&P found support on the SMAs and never broke below the 200-day SMA.
4. After around 750 days, the S&P broke below the rising wedge, lost all key SMA support, and made a lower low.
5. A bearish cross between the 50-day SMA and the 100-day SMA is currently forming.
When we overlay the bar pattern of the 2021 bearish price action onto the current chart, it suggests that a revisit to 4,750 is possible. This level is both a technical support and the point where the S&P started its downtrend in 2021.
Conclusion
Will the S&P follow the 2021 price action, resulting in a sustained downtrend, or will it reclaim all lost SMA levels and continue its uptrend? The price action suggests that there is a real possibility of weakness in the coming months.
S&P500 down -4.84%, worst day since 2020 COVID crash! GAME OVER?The S&P500 (SPX) had yesterday its worst 1D closing (-4.84%) in exactly 5 years since the COVID flash crash started on March 11 2020 (-4.89%). Not even during the 2022 Inflation Crisis did the index post such strong losses in a day.
Obviously amidst the market panic, the question inside everyone's minds is this: 'Are we in a Bear Market?'. The only way to view this is by looking at SPX's historic price action and on this analysis we are doing so by examining the price action on he 1W time-frame since the 2008 Housing Crisis.
As you can see, starting from the Inflation Crisis bottom in March 2009, we've had 4 major market corrections (excluding the March 2020 COVID flash crash which was a Black Swan event). All of them made contact with the 1W MA200 (orange trend-line) and immediately rebounded to start a new Bull Cycle. Those Bull Cycles typically lasted for around 3 years and peaked at (or a little after) the red vertical lines, which is the distance measured from the October 15 2007 High to the May 07 2011 High, the first two Cycle Highs of the dataset that we use as the basis to time the Cycles on this model.
The Sine Waves (dotted) are used to illustrate the Cycle Tops (not bottoms), so are the Time Cycles (dashed). This helps at giving a sense of the whole Cycle trend and more importantly when the time to sell may be coming ahead of a potential Cycle Top.
This model shows that the earliest that the current Cycle should peak is the week of August 11 2025. If it comes a little later (as with the cases of October 01 2018 and June 01 2015), then it could be within November - December 2025.
The shortest correction to the 1W MA200 has been in 2011, which only lasted 22 weeks (154 days). The longest is the whole 2008 Housing Crisis (73 weeks, 511 days). All other three 1W MA200 corrections have lasted for less than a year.
On another note, the 1W RSI just hit the 34.50 level. Since the 2009 bottom, the market has only hit that level 5 times. All produces immediate sharp rebounds. The December 17 2018, March 16 2020 and August 15 2011 RSI tests have been bottoms while May 09 2022 and August 24 2015 bottomed later but still produced sharp bear market rallies before the eventual bottom.
Uncertainty is obviously high but these are the facts and the hard technical data. Game over for stocks or this is a wonderful long-term buy opportunity? The conclusions are yours.
-------------------------------------------------------------------------------
** Please LIKE 👍, FOLLOW ✅, SHARE 🙌 and COMMENT ✍ if you enjoy this idea! Also share your ideas and charts in the comments section below! This is best way to keep it relevant, support us, keep the content here free and allow the idea to reach as many people as possible. **
-------------------------------------------------------------------------------
💸💸💸💸💸💸
👇 👇 👇 👇 👇 👇
S&P500 6th time in 14 years that this buy signal flashes.S&P500 is sinking under its MA50 (1w) and is headed straight to the next support level, the MA100 (1w).
Last time it touched this level was in October 30th 2023 and that's alone a great buy signal.
It's the RSI (1w) you should be paying attention to as it is approaching the 33.00 level, which since August 2011 it has given 5 buy signals that all touched the MA100 (1w).
Obviously in 2022 we had a bear market, March 2020 was the COVID Black Swan and December 2018 the peak of the U.S.-China trade wars.
Trading Plan:
1. Buy on the MA100 (1w).
Targets:
1. 6500.
Tips:
1. This is a long term trade and it is all about your approach to risk. If you can handle unexpected dips below the MA100 (1w), then you will be greatly rewarded by the end of 2025.
Please like, follow and comment!!
S&P500: Recovery has started and the next stop is the 1D MA50.S&P500 is marginally neutral on its 1D technical outlook (RSI = 45.213, MACD = -61.280, ADX = 30.163) as it's recovered from Friday's bearish sentiment and already crossed above the 0.236 Fibonacci level. This rebound made Monday's low a Double Bottom and since the 1D RSI is on a HL bullish divergence, we expect a strong 1 month rally to start. The first target is the 1D MA50 slightly over the 0.5 Fib mark (TP1 = 5,835) and after a small correction, the 0.786 Fib (TP2 = 6,000), which is also the top of the 5 month Bull Flag.
## If you like our free content follow our profile to get more daily ideas. ##
## Comments and likes are greatly appreciated. ##
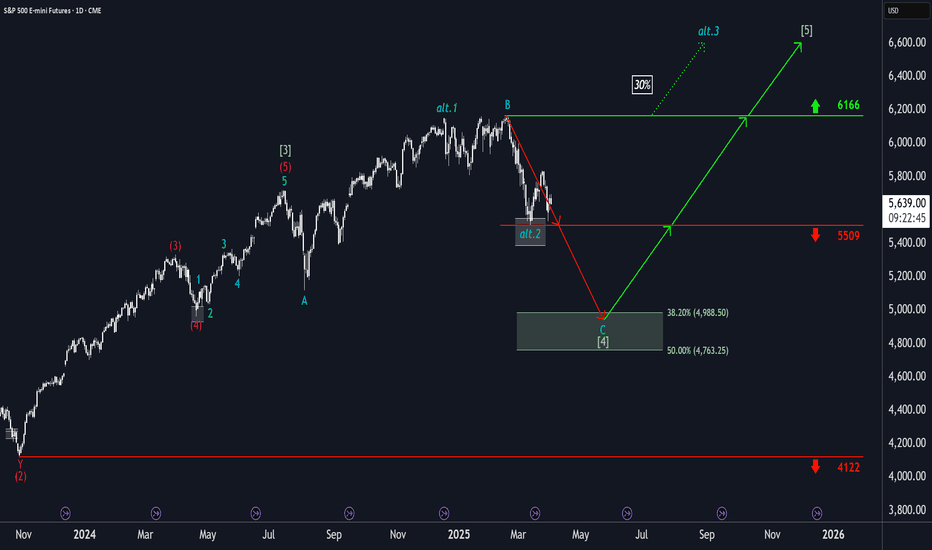
S&P500: Persistent SupportThe S&P 500 continued its recovery following its reaction to the support at 5509 points. However, in our primary scenario, we expect the index to fall below this mark to ultimately complete wave in green within our color-matched Target Zone (coordinates: 4988 points – 4763 points). Within this range, there are entry opportunities for long positions, which could be hedged with a stop 1% below the Zone’s lower boundary. Once the corrective movement has reached its low, the final upward movement of the green wave structure should commence. In the process, the index should gain significantly and reach the high of wave above the resistance at 6166 points. If this mark is surpassed prematurely, our alternative scenario with a 30% probability will come into play.
Wall Street vs GoldZilla. The End of 'Irrational Exuberance' Era"Irrational exuberance" is the phrase used by the then-Federal Reserve Board chairman, Alan Greenspan, in a speech given at the American Enterprise Institute during the dot-com bubble of the 1990s. The phrase was interpreted as a warning that the stock market might be overvalued.
Origin
Greenspan's comment was made during a televised speech on December 5, 1996 (emphasis added in excerpt)
Clearly, sustained low inflation implies less uncertainty about the future, and lower risk premiums imply higher prices of stocks and other earning assets. We can see that in the inverse relationship exhibited by price/earnings ratios and the rate of inflation in the past. But how do we know when irrational exuberance has unduly escalated asset values, which then become subject to unexpected and prolonged contractions as they have in Japan over the past decade?
Greenspan wrote in his 2008 book that the phrase occurred to him in the bathtub while he was writing a speech.
The irony of the phrase and its aftermath lies in Greenspan's widely held reputation as the most artful practitioner of Fedspeak, often known as Greenspeak, in the modern televised era. The speech coincided with the rise of dedicated financial TV channels around the world that would broadcast his comments live, such as CNBC. Greenspan's idea was to obfuscate his true opinion in long complex sentences with obscure words so as to intentionally mute any strong market response.
The phrase was also used by Yale professor Robert J. Shiller, who was reportedly Greenspan's source for the phrase. Shiller used it as the title of his book, Irrational Exuberance, first published in 2000, where Shiller states:
Irrational exuberance is the psychological basis of a speculative bubble. I define a speculative bubble as a situation in which news of price increases spurs investor enthusiasm, which spreads by psychological contagion from person to person, in the process amplifying stories that might justify the price increases, and bringing in a larger and larger class of investors who, despite doubts about the real value of an investment, are drawn to it partly by envy of others' successes and partly through a gamblers' excitement.
The main technical graph represents a value of S&P500 Index in Gold troy ounces (current value 1.81 at time of writing this article), indicates that effusive Bull stock market goes collapsing.
--
Best wishes,
Your Beloved @PandorraResearch Team 😎
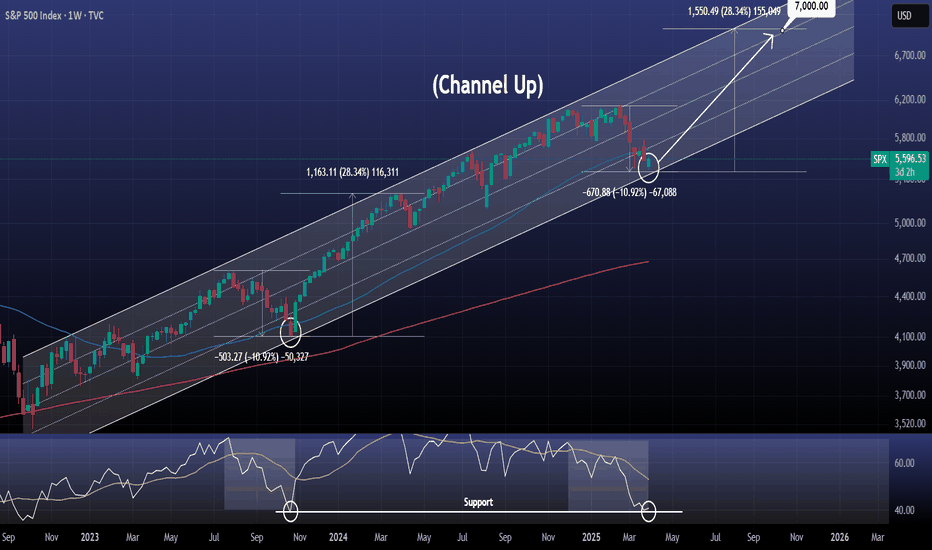
S&P500 Last time it made that bottom was 18 months ago.S&P500 / US500 is trading inside a multi year Channel Up that goes back to October 2022.
The index almost hit the Channel bottom this week and immediately we see a rebound attempt.
It may be under the 1week MA50 but this is not disastrous as the patterns last bottom was formed exactly under it on October 23rd 2023, 18 months ago.
On top of that, the 1week RSI was exactly where it is now, on the 40.00 Support, bearish enough to call for a long term buy.
In addition, the both bearish waved leading to both bottoms were almost -11%. This high symmetry potential suggests that the bullish wave that will follow may be of a similar +28.34% rise.
This is a unique opportunity to buy and target 7000.
Follow us, like the idea and leave a comment below!!
ES1 2025-03-31 SPOOZ 15minOBHello everyone, I hope you won, stayed out, or learned something form the market today 😂.
Today was a easy grab.
Drawdown: 17. Tics
TP: 111. Tics Grabbed (out of 438)
Spooz Open Manipulation,
Broke near high,
Retraced to 15min Order Block,
TP Hit at 3 equal Highs (volume).
If you found this inciteful, join our group discussion! (link in bio)
S&P500 during TRUMP's 2018 vs 2025 TRADE WAR.The S&P500 index (SPX) has started off the year in disappointing fashion as since mid-February the market has corrected by over -10% and of course almost all of it is attributed to the trade tariffs imposed by President Trump. As you know, this is not the first time Trump goes into a Trade War. The 1st has started in January 2018 when the first tariff announcements were made against China.
We can say that Trump's 2nd Trade War officially started on March 03 2025, with tariff implementations against Mexico, Canada and China. As you can see, the build up to both Trade Wars has been identical both in structural price count and in 1W RSI terms.
By the week of February 05 2018, the index has dropped by a little over -11%, hit the 1W MA50 (blue trend-line) and the 0.236 Fibonacci retracement level and rebounded, while the 1W RSI formed a Lower Low. We can claim that this are roughly the levels we are now. That drop started a Megaphone pattern, which ran through all of 2018. The ultimate bottom for this Megaphone Trade War pattern came in December 24 2018 on the 1W MA200 (orange trend-line).
Right now, the 1W RSI is almost on Lower Lows while crossing below its 1W MA50 and what remains to be seen is if it will hit its 0.236 Fib to form the bottom of the Megaphone or will rebound now.
Do you think Trump's 2nd Trade War will keep the market highly volatile within a Megaphone or will plunge it even more?
-------------------------------------------------------------------------------
** Please LIKE 👍, FOLLOW ✅, SHARE 🙌 and COMMENT ✍ if you enjoy this idea! Also share your ideas and charts in the comments section below! This is best way to keep it relevant, support us, keep the content here free and allow the idea to reach as many people as possible. **
-------------------------------------------------------------------------------
💸💸💸💸💸💸
👇 👇 👇 👇 👇 👇
The Stock Market Decline Appears to be only in the US as of nowLast week on one of my member live videos I pointed out to the attendees that European markets were currently at, or very close to their All-Time highs...whereas in the US, we've entered the technical definition of a stock market correction...(down 10%). If you're so inclined to Google an economic calendar, it also appears the economic metrics like CPI, unemployment, etc... appear much better as well. There's an old adage in the markets.... "When the US sneezes, the global economy catches a cold" . However, at this very moment in time, the only thing that appears sick is the US. Maybe that changes with time. I suspect that will be the case...but in any event, one thing that is clear is that our stock market indices are signaling that whatever economic sickness is to be contracted, it will have originated here...in the United States.
That is certainly a new phenomenon.
For the past couple years I have been warning my members (and followers here on Trading View) of a long-term top in the stock markets. Week after week in my trading room, I have commented that I believe I have all constituent waves accounted for, to the best of my ability, to say with a high degree of confidence that a super-cycle wave (III) has topped .
What we have lacked is the price action to confirm that statement. This morning, I cannot tell you we have confirmation. That confirming probability only comes when price declines below the area of the wave 4 of one lesser degree. That area is outlined in the SPX daily chart entitled the "Must Hold Region". We are not there yet, nor do I think price makes a bee-line there in one shot. Therefore, I am NOT in panic mode this morning because I do believe we need a retrace higher and only that retracement's structure will inform us the higher probability of future price subdivisions....(higher or lower).
Panic is the necessary trader behavior needed to decline in such fashion as I believe a super cycle wave (IV) will start out. However personally, I do not think it's today. Futures are red this morning and closer to the recent lows than last week...the headlines surrounding the stock market appear very negative...but as of this morning, the MACD indicator on intraday charts is saying this type of sentiment is getting slightly weaker and NOT making new lows.
Therefore, I continue to maintain the price and technical indications tell me a minor B is either currently underway, or will be confirmed in the short term. Until those parameters get flipped, I'll reserve my panic (so to speak) for the c of (c) of intermediate (A) into the must hold region later this year... where it will probably be justified at that time.
Best to all,
Chris
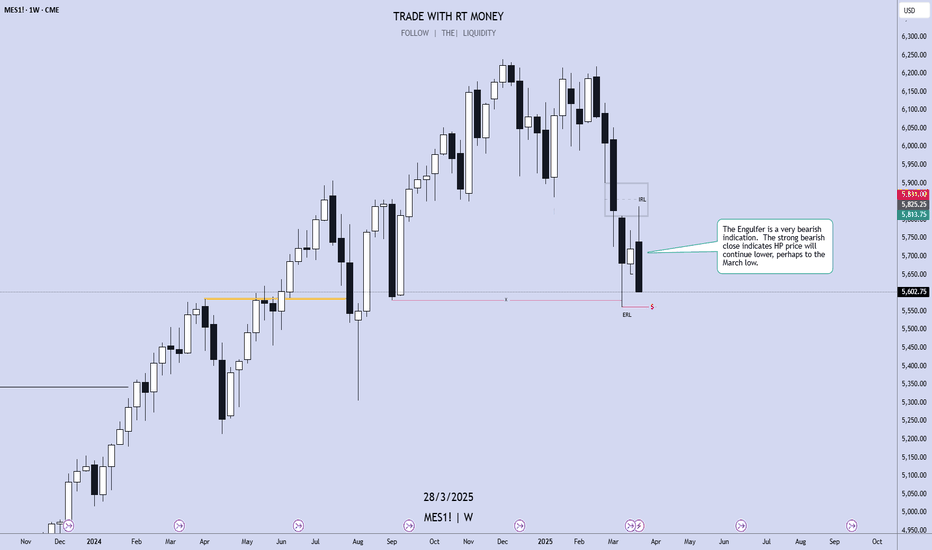
Weekly Market Forecast: SELL THE INDICES!In this video, we will analyze the S&P 500, NASDAQ, AND DOW JONES Futures for the week of March 31st - April 4th.
The equity markets took a bearish turn last week. This is likely to continue for the upcoming week.
Monday is the end of March. Tuesday brings a new week and new opportunities. April 2nd brings... potentially market flipping volatility. The day the Trump tariffs are implemented.
Be careful. Let the market give you direction, and then get involved.
Enjoy!
May profits be upon you.
Leave any questions or comments in the comment section.
I appreciate any feedback from my viewers!
Like and/or subscribe if you want more accurate analysis.
Thank you so much!
Disclaimer:
I do not provide personal investment advice and I am not a qualified licensed investment advisor.
All information found here, including any ideas, opinions, views, predictions, forecasts, commentaries, suggestions, expressed or implied herein, are for informational, entertainment or educational purposes only and should not be construed as personal investment advice. While the information provided is believed to be accurate, it may include errors or inaccuracies.
I will not and cannot be held liable for any actions you take as a result of anything you read here.
Conduct your own due diligence, or consult a licensed financial advisor or broker before making any and all investment decisions. Any investments, trades, speculations, or decisions made on the basis of any information found on this channel, expressed or implied herein, are committed at your own risk, financial or otherwise.
S&P500 Huge retest of former Channel Down.S&P500 / US500 took a big hit today following the higher than expected PCE, causing a price rejection on the 4hour MA50.
So far however the drop stopped exactly at the top of the former Channel Down of February-March.
With the 4hour RSI on the same level as March 10th, if this level holds, it will be a huge retest buy signal and will start a new bullish wave.
Based on this, we'd expect the 1day MA50 to be targeted at 5,850.
Follow us, like the idea and leave a comment below!!
S&P500 Do you really want to bet against the market??We have done a number of multi-decade analyses on both S&P500 (SPX) and Dow Jones over the years. Especially in times of high volatility, such as the current ones amidst the tariff wars, the long-term macro-economic analysis always helps to keep the most objective perspective.
And as you see in the wide picture of SPX's 35-year Cycles, the current 3-month correction is nothing but a technical pull-back that justifies the rule. The 1M MA50 (blue trend-line) tends to be the main Support during the Bull Phase and then it breaks, the Bear Cycle starts that drops even below the 1M MA200 (orange trend-line).
Right now, assuming the current Cycle that started after the early 2009 Housing Crisis bottom, will be as long as the previous one at least, we are headed for the 0.5 Time Fibonacci level (blue) and are marginally above the 0.382 Horizontal Fibonacci level (black). This is the exact kind of behavior we had on the previous Cycle with the 1990 pull-back, which as expected approached the 1M MA50 and rebounded. In 1954, the index was again headed for the 0.5 Time Fib and was on the 0.382 Horizontal Fib.
It is obvious that the degree of symmetry among the Cycles is remarkable and as long as the 1M MA50 holds, any pull-back should historically be bought. As we head towards the 0.786 Time Fib though, the danger of staying in the market gets extremely high but as mentioned, a break below the 1M MA50 is the confirmed sell signal.
This shows that despite the recent volatility, buying is still heavily favored. Are you willing to bet against the market at this stage?
-------------------------------------------------------------------------------
** Please LIKE 👍, FOLLOW ✅, SHARE 🙌 and COMMENT ✍ if you enjoy this idea! Also share your ideas and charts in the comments section below! This is best way to keep it relevant, support us, keep the content here free and allow the idea to reach as many people as possible. **
-------------------------------------------------------------------------------
💸💸💸💸💸💸
👇 👇 👇 👇 👇 👇
Trump's Auto Tariffs Shake Things Up on Wall StreetTrump's tariffs are clearly not going away. In fact, he's upped the ante with a 25% tariff on all non-US cars, vowed to target pharmaceuticals and promised more are to come on April 2nd. Given the dire weakness in consumer sentiment data, I suspect Wall Street indices may have seen a swing high.
Matt Simpson, Market Analyst at City Index and Forex.com
S&P500: Recovered the 1W MA50. Best buy opportunity of 2025.The S&P500 is marginally neutral on its 1D technical outlook (RSI = 47.606, MACD = -47.070, ADX = 35.637) as it is in the process of recovery from the previous oversold condition. What the index did recover however, and which is a massive buy signal, is the 1W MA50. Technically this trendline held two weeks ago, despite marginally crossing under it, and provided the basis for a new long term bottom. Basically it is the exact same pattern as the October 23rd 2023 bottom, which was also a HL on the 3 year Channel Up, declined also by -11% and the 1W RSI was almost on the same level as today's low (the S1 level).
Every bullish wave inside this 3 year pattern hit at least the 2.0 Fibonacci extension. Given that this bottom was made on the 0.618 Channel Fib level, like both of the last two HL (Aug 5th 2024, April 15th 2024), we expect a test of the Channel's top by the end of the year. A TP = 6,700 would still be under the 2.0 Fib extension and that's out long term target.
## If you like our free content follow our profile to get more daily ideas. ##
## Comments and likes are greatly appreciated. ##


