S&P500 The correction is over. Bullish trend intact.The S&P500 (SPX) has been rising steadily since our June 17 bullish break-out signal (see chart below) and despite this week's pull-back, the upward pattern remains unchanged:
As long as it continues to be supported by the 1D MA50 (blue trend-line), we remain bullish with our Target intact at 5800, marginally below the 2.618 Fibonacci extension.
On a side-note, observe the uncanny symmetry between the RSI structures of the Bullish Legs. We are now on a similar pull-back recovery formation as on the January 31 2024 and June 26 2023 short-term Lows.
-------------------------------------------------------------------------------
** Please LIKE 👍, FOLLOW ✅, SHARE 🙌 and COMMENT ✍ if you enjoy this idea! Also share your ideas and charts in the comments section below! This is best way to keep it relevant, support us, keep the content here free and allow the idea to reach as many people as possible. **
-------------------------------------------------------------------------------
💸💸💸💸💸💸
👇 👇 👇 👇 👇 👇
Es1

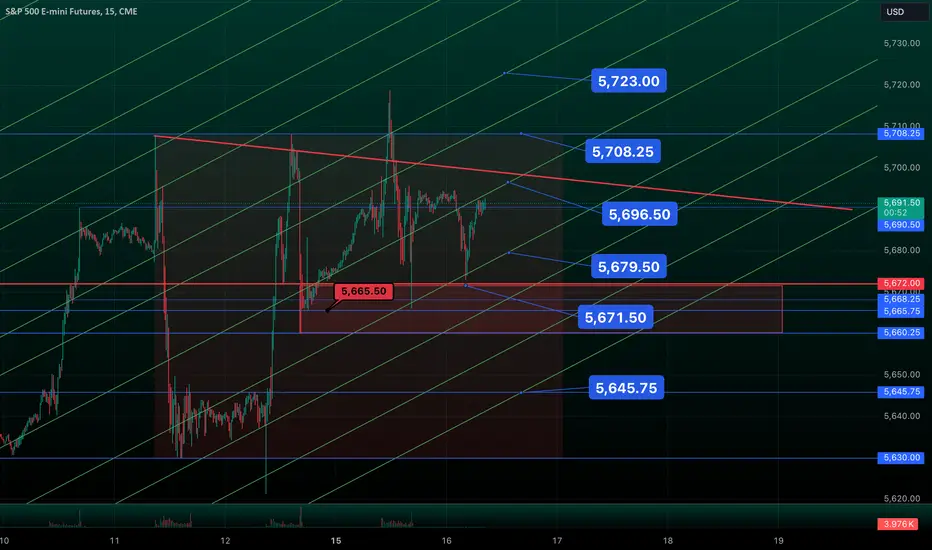
ES Levels/Targets July 16thFor 3 days now, 5668-73 area has been very key in ES. We failed from it Friday afternoon, trapped sellers, then squeezed 50 points. We did the exact same thing yesterday 4pm, and it held again overnight to the tick. As of now: More chop likely. 5679, 5668 are main supports. staying above keeps 5696-98, 5708+ in play. We dip only if 5668-65 fails
Cyclically speaking....is it time to sell stocks?Introduction
Within the larger Elliott Wave community (of Elliottitions; practitioners of Elliott Wave Theory) there has been an ongoing notion, that is gaining in popular perspective, that the US stock markets are very close to entering a super cycle wave (IV)…myself included.
However, from what we know of Elliott’s original work, which was based on social and economic behaviors concerning market participants, and the use of Fibonacci numbers…is when this normal cycle starts, we will not know with a high degree of certainty this is what is occurring likely until its ending.
Background
Ralph Nelson Elliott was an accountant by trade born the late 19th century who also studied the US Markets. Post the 1929 stock market crash, and as a reader of Charles Dow’s Customer Afternoon Letter, (which later became the basis for today’s Wall Street Journal) Elliott began to formulate the basis of Elliott Wave Theory by noticing patterns that seemingly repeated (mathematical fractals) across monthly chart timeframes, all the way down to the 30-minute increments of price action within the stock markets. He stated that the behavior of market participants was cyclical in their actions, predictable in the outcome, and therefore highly forecastable well into the future.
Although Elliott Wave Theory is criticized for a multitude of reasons that I will not get into here, I can clear up this, or any criticism of the technical analysis by simply stating I use EWT everyday as a trader to make a living. If the principles largely bare out each and every day on the smaller scales, regardless of the security (as long as there is a large number of participants) it’s highly implausible they would NOT fail when applied to the very long-term charts.
My Analytical Perspective
From Elliott’s original work he wrote…
Corrections are typically harder to identify than impulse moves. In wave A of a bear market, the fundamental news is usually still positive. Most analysts see the drop as a correction in a still-active bull market. Some technical indicators that accompany wave A include increased volume, rising implied volatility in the options markets and possibly a turn higher in open interest in related futures markets.
In the above chart you'll notice I have placed a red target box in the area of where a normal a-wave would reconcile to. It is while involved in this initial decline of a super cycle wave (IV) that sort of market reaction will be reported as a deep, but common run-of-the-mill bear market that was overdue. Given the meteoric rise in stock prices, it only stands to reason that we would consolidate those.
This will give credence to my suspicion that we will not know we're only just starting this long-term consolidation. What will follow next should be a very long drawn-out b-wave, that has the protentional to rally back towards the current levels (maybe slightly below). This portion of the pattern will take many years, possibly a decade. The price action will take long enough to where participants may even feel that the a-wave bear market is over, and we're now involved in another bull market cycle to new highs. This will go a long way to justifying the narrative that the previous market decline was a speed bump on the way to much higher levels now.
Again, Elliott states with respect to a b-wave in general and how we could potentially view this portion of the super cycle wave (IV).
Prices reverse higher, which many see as a resumption of the now long-gone bull market. Those familiar with classical technical analysis may see the peak as the right shoulder of a head and shoulders reversal pattern. The volume during wave B should be lower than in wave A. By this point, fundamentals are probably no longer improving, but they most likely have not yet turned negative.
The b-wave, from bottom to top, can provide opportunities for traders for the duration as it will be a trader’s market. This is where the majority of this long term cycle will reside.
The final outcome of a super cycle wave (IV) and why I state in the beginning of this article as to why we may not know this was a multi-decade super cycle wave (IV) is prices may be approaching the previous highs before we get one of two outcomes of neither are good. The first outcome is a stock market crash that could resemble it’s cyclical wave (II) but in alternating form. This would be devastating loss of wealth in a very short term period of time…whereas, the second option is a slightly more controlled decline, and although not classified as a stock market crash, will certainly feel like one as the declines will be steady, consistent and overtime versus all at once.
In conclusion, could the current price action to higher levels continue to persist? Yes. I am not saying this market has topped. No key levels of support have been breached. The trajectory I am expecting is as per the below and as key levels of price action that have supported this rally are breached the pathway forecasted takes on a more standard decline based on Fibonacci retracement levels.
Daily Chart
Only cycle a-wave labeled.
Cyclically speaking....is it time to sell stocks? I cannot answer that because the strategy of investing in the stock market depends on the person, their age, and their investment goals. These are decisions only you can make.

Bulls and Bears zone for 07-11-2024Yesterday S&P 500 hit another ATH and has been rallying for last several days.
Any test of yesterday's Close could provide direction for the day.
Level to watch: 5680 ---5678
US:EIA Natural Gas Report
10:30AM ET

ES Levels & Targets for CPI day. July11thBuyers have giving us a historic run for over 180 points since last week Tuesday’s 5506 failed breakdown, with real 0 dips. CPI at 830, size way down now, expect irrelevant noise and traps for the 1st 30mins or so. Anything can happen. As of now: 5670-72 is support. Buyers must hold (or recover quickly if not) to keep 5690, 5696, 5710+ in play. 5670 fails, sellers dip us to 5660, 5642

S&P500 Short-term buy signal.The S&P500 index (SPX) is just after the middle of the new Bullish Leg of the 3-month Channel Up, supported by both the 4H MA50 (blue trend-line) and the 4H MA100 (green trend-line). The Sine Waves have been very efficient at projecting the bottoms and tops (Higher Lows and Higher Highs respectively) throughout the pattern.
Right now the index is approaching such a top and once the 4H RSI makes a Double Top, it will be time to take profit. Rough projection, we expect that to be around 5700 and that is our Target unless the RSI double tops earlier.
-------------------------------------------------------------------------------
** Please LIKE 👍, FOLLOW ✅, SHARE 🙌 and COMMENT ✍ if you enjoy this idea! Also share your ideas and charts in the comments section below! This is best way to keep it relevant, support us, keep the content here free and allow the idea to reach as many people as possible. **
-------------------------------------------------------------------------------
💸💸💸💸💸💸
👇 👇 👇 👇 👇 👇

OHLC Stat Map + Average Range Levels1D -Manipulation turned to support after price broke it that was a first confluence. Entry was based on 1/3ADR+ & 1/3 AWR+ which also turned to support after price broke them, My target was 1D +Distribution. Rinse a Repeat.

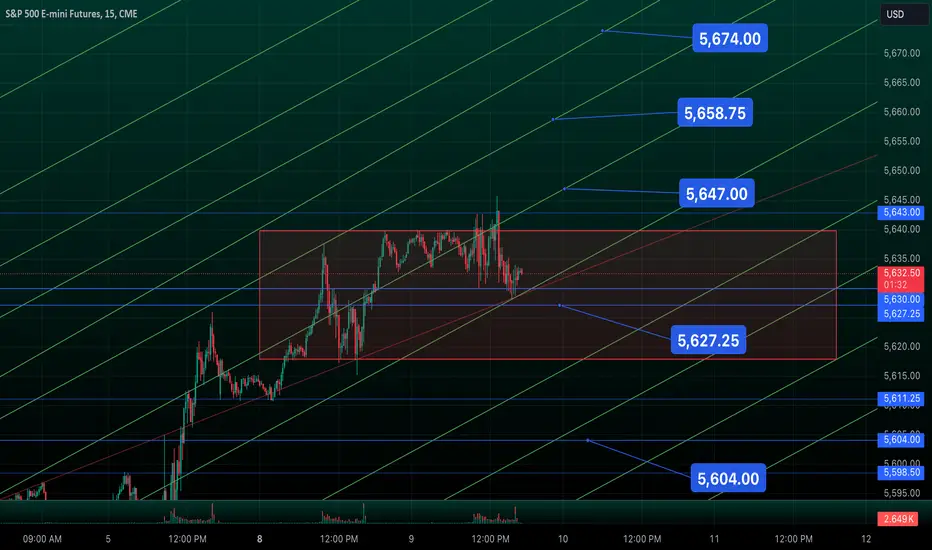
Full ES Trading Plan for July 10thPlan for Wednesday: supports are 5627-30 (major), 5618-20 (major), 5615, 5611, 5604 (major), 5598 (major), 5593, 5585 (major).
We are in very low-quality trading conditions, which will persist until an external catalyst, like the CPI report on Thursday, brings more volatility. For now, we face low-quality, post-rally, midsummer fluctuations. As noted yesterday, if you plan to overtrade in these conditions, it's best to shut down your computer and save your capital. For now: 5627-30 to 5641 is the new chop zone, with everything in this being untradeable slop. 5627-30 is first support down, but has been tested heavily today so is no longer a reliable level. I would only consider engaging it if sellers can flush to 5627ish or lower then buyers pop back above 5630 to trap sellers, but even that is poor quality in the conditions we are in. Below there is 5620 support. One can try longs here to catch a few points. If sellers take us lower than that, we probably flush quite hard and I would not be interested in trying longs again until 5604. sellers flushing it, then buyers reclaiming it is always safer than buying direct.
Resistances are: 5634, 5640-42 (major), 5644, 5647 (major), 5654, 5658 (major), 5664, 5670, 5674 (major), 5682 (major), 5687, 5697, 5708, 5717. All members know, I have a hard rule not to short resistances in ES, so I won’t be shorting any of the above resistances. For those who like these low win rate trades though, 5658 would be one spot to try shorts at... as would 5674. 5640-42 may also have one final dip left in it but a high risk.
Buyers case: Nothing has changed, to be honest. The levels just vary slightly each day as time goes on. For tomorrow, buyers need 5620 to hold. If it does, ES is likely to form a structure between 5620 and 5640. From there, buyers would likely push up again, targeting 5647, 5658, and then 5674+. Normally, I provide entries for adding on strength, but given our stretched position, there aren't any high-quality opportunities. Perhaps look for pops above 5633-34, but be prepared to enter and take profits aggressively at the first level up."
Sellers case: Starts with the failure of 5618-20, with 5630-27 failure as the initial micro trigger. For the 5618-20 failure, I need to see a test here followed by a bounce or a failed breakdown to fully use up the level. After this, I'd consider going short around 5617 for a level-to-level dip. Refer to previous plans for the risks associated with these types of trades."
In general, we continue to experience post-rally chop, and I will maintain light trading until conditions change. This huge move buyers have gave us for the past week could end abruptly and without warning, likely due to a catalyst now though, and it could happen at any time. Until then, I must follow the trend only, as that's what allows me to maintain an 85% + win rate for the year. As long as the 5620 level holds (and if the bulls are highly motivated, 5630 will also hold), we can establish a base around 5620-5642 before beginning the next upward movement to 5647, 5658, 5674, or higher. If 5620 fails, sellers dip us.

S&P500 Shifted to new bullish pattern. 5750 next.The S&P500 index (SPX) made a major bullish break-out in accordance to our previous analysis (June 17, see chart below), where we clearly stated that a break above the 1.5-year (Fibonacci) Channel Up pattern it would indicate a transition to a new (blue) Channel Up:
As you can see that happened and the index is extending that blue Channel, with the long-term prevailing pattern now being the dashed Channel Up. Technically it appears that the price is rising straight after finishing a Cup consolidation structure that is no stranger to it as we've seen it another two times, always leading in the end either to a 2.383 Fibonacci extension target or around +30% rise from the top.
On the current Bullish Leg, the 2.382 Fibonacci extension comes much lower than a potential +30% rise from the April 19 bottom, so as mentioned on our previous analysis, we will be targeting (this time slightly lower) at 5750. If the 2.382 Fib breaks and we close a 1W candle above it, we will extend buying all the way to +30%, i.e. just above 6300.
-------------------------------------------------------------------------------
** Please LIKE 👍, FOLLOW ✅, SHARE 🙌 and COMMENT ✍ if you enjoy this idea! Also share your ideas and charts in the comments section below! This is best way to keep it relevant, support us, keep the content here free and allow the idea to reach as many people as possible. **
-------------------------------------------------------------------------------
💸💸💸💸💸💸
👇 👇 👇 👇 👇 👇

Es Target and Levels for July 4thThis week my main target in ES was 5582 from Tuesday’s failed breakdown at 5506. We hit it. 5596 was next up, been basing here all night. Holiday today, hold runners/do nothing As of now: As long as buyers are above 5582-78: 5603-5607, 5615+ next up. Dip if 5578 fails

S&P500: Final Sprint!Although the current wave 5 in turquoise has already reached a significant size, and the high should be placed soon, we cannot yet regard it as completed. We therefore continue to give the movement room to the upside. As soon as the high is established, the index should turn and head for our magenta Target Zone (coordinates: 4681 - 4434 points). However, please note our alternative scenario (40% probable). In this case, the index would place the top of the green wave alt. (3) with the next high. Consequently, a reversal and a transition into the wave alt.(5) could already be expected in our green Target Zone (coordinates: 5056 - 4878 points).

ES Levels & Targets For July 3rdYesterday morning, ES printed an excellent failed breakdown of the previous days low at 5506, triggering longs for seasoned buyers. After that, all upside targets I shared yesterday hit with ease, and now ES has been basing all night. Half trading day today. As of now: As long as buyers are above 5558, 5575, 5582 next up. 5558 fails, dip to 5542

ES Targets For TodayFor the past week it's been about one level: 5519…which paid out over 150 points so far in total. Last night, we tested it for 16th time, bounced 8 points right up to 5527 target, then lost it. Currently attempting to hold a major support. As of now: 5503-06 is all a major support with 5519 the obvious backtest area. Buyers must reclaim it to put in a bottom. 5503 fails, dip to 5492-24ish

Bulls and Bears zone for 07-02-2024Yesterday, S&P had a moderate gain. But during ETH session traders are testing yesterday's Low.
Level to watch : 5512 ---5514
News to watch:
9:30 AM US: Jerome Powell Speaks
10:00 AM US:JOLTS

ES Levels & Targets for July 1st/TipFor y’all that don’t know, July 1st is the most bullish day of the year seasonally, green 90% of years sice 2003 and up for the last 13 years straight. What does that mean for us? Absolutely nothing, because we trade price, not seasonals. Of course, these tendencies are good to keep in the back of your head as are all seasonal tendencies, but when it comes to actual trading, we trade the same way we do every day. Wait for the setups, take them without bias, manage it level to level, repeat. We must trade what is in front of us, not averages.
Specifically for tomorrow, 5519 has been a true ATM machine in CME_MINI:ES1! . From where we are now, I see 5519-5582 as being a large chop zone. But as buyers keep holding 5519, we can continue filling the range out.. This would mean retesting 5539, perhaps dip, then heading to 5557-60 again. If 5519 fails, buyers will have to reclaim it quick or sellers can try to start a deep leg down for a move sub 5500.

🏯 TOPIX FUTURES: JAPANESE BULL SAMURAI IS STILL ALIVELegendary investor Warren Buffett was on a trip to Tokyo, the capital of Japan, two months earlier in mid-April 2023, and the titans of the country's giant energy and commodity conglomerates were there to make their presentations.
As usual, over glasses of Coca-Cola NYSE:KO - one of Buffett's most famous investments, they walked into Warren Buffett's suite at the luxury Four Seasons hotel and individually told the 92-year-old American investor the same thing: Japanese trading houses are cheap and should accelerate their move beyond commodities.
The support of the Oracle of Omaha is an important vote of confidence in the big five Japanese trading houses - Mitsubishi Corporations TSE:8058 , Mitsui TSE:8031 , Sumitomo TSE:8053 , Itochu TSE:8001 and Marubeni TSE:8002
It's also a broad endorsement of Japan, that is considered to have outlived its heyday 30-35 years ago, as well as considered less relevant than Asian counterparts such as China and India.
But there's one big question: Is Buffett betting on phasing out fossil fuels, the trading house products themselves, or a combination of the two? Or something else, like impact of the weak yen!?
Buffett's Berkshire Hathaway NYSE:BRK.B reported in August 2020 that it had acquired about 5% of the shares of five trading houses, that sent their stocks up and raised their total investment value above $6 billion. When the Covid-19 pandemic dampened demand for goods, it pushed down the value of company stocks, four of which traded below book value.
“They were selling, I thought, at a ridiculous price,” - Buffett said to CNBC in March 2023.
Three years after the Covid-19 pandemic (that is now hardly remembered) Warren Buffett's bets on Japan have nearly tripled to over $17 billion.
But even this Growth does not stop Buffett. Staying in Tokyo this spring, Buffett confirmed intentions to buy more shares, and participate in more big deals.
In addition, Berkshire recently unveiled plans to issue its own yen-denominated bonds, which help hedge against the depreciation of the yen against the US dollar as well as depreciation of Japanese stocks in dollar terms.
The technical main chart is dedicated to futures on the TOPIX index TSE:TOPIX widely known, along with the Nikkei 225 index $TSE:NKY .
The TOPIX index is an important stock market index for the Tokyo Stock Exchange (TSE) in Japan, tracking all the local companies of the TSE Prime-market division.
Buffett's mission to Japan marked, as it easy to find in the technical picture of TOPIX ( TSE:TOPIX ) - a significant moment, as a result of the breakdown of the key long-term resistance, with the prospect of further more than doubling the index TSE:TOPIX and its market value.

Bulls and Bears zone for 06-28-2024So far this week, three days in a row S&P has been making slow gains. However, intraday trading has been range bound.
Any test of yesterday's Close could provide direction for the day.
Level to watch : 5554 --- 5556
News to watch:
945am: US Chicago PMI
10am : US Consumer Sentiment

ES -Manipulation & 1/3ADR+Todan in NY AM Session ES -Manipulation 4H targeting 1/3ADR+ 1:4RR booked ✅

OHLC Stat Mapping Short as Always!-Manipulation Daily acted as beautiful resistence target was opposing +manipulation! 1:3RR ✅

S&P500 Seeking the 4H MA200 for buyersThe S&P500 index (SPX) got rejected at the top of the 2-month Channel Up that started on the April 19 bottom and is already below the 4H MA50 (blue trend-line). This is a sign of weakness for the short-term and based on the previous two times it did so, it might be accelerated.
Technically, the market should seek the 4H MA200 (orange trend-line) as the Support, which is what took place on the previous Higher Low of the Channel Up on May 31. We are looking to turn bullish again close to the 4H MA200 and target 5650, which is not only at the top of the Channel Up but also below the 2.618 Fibonacci extension, which is where the previous two Higher Highs got priced.
-------------------------------------------------------------------------------
** Please LIKE 👍, FOLLOW ✅, SHARE 🙌 and COMMENT ✍ if you enjoy this idea! Also share your ideas and charts in the comments section below! This is best way to keep it relevant, support us, keep the content here free and allow the idea to reach as many people as possible. **
-------------------------------------------------------------------------------
💸💸💸💸💸💸
👇 👇 👇 👇 👇 👇

OHLC Stat Mapping Cooks Every Day & Every Week and it won't stopOn ES OHLC STAT MAPPING Cooked as Always! Do you see that precision? that is hilarious and definetely not random... just checkout my profile and see how many examples I have there with this insane tool. forever grateful I discovered this tool.

S&P 500: One last ClimbWe see the S&P 500 primarily on the last few meters of the magenta wave (1). Although it is of course absolutely possible that we have already seen the high, the price is likely to rebound once more before it brings this movement to an end. Subsequently, we expect a medium-sized correction in the form of the magenta wave (2), which should extend to our same-colored Target Zone between 4851 and 4678 points.
