$spx on a parabolic FithCBOE:SPX is climbing it's 5th and last (?) wave from the parabolic rise created since the GFC... targets about 5600 CBOE:SPX and from there I do expect the October 2022 lows to be taken out at last...
Es1
S&P500 The final pull back before Santa's rally!The S&P500 index / US500 has been on the strongest 2 week rise since October 2022, which was at the very start of the Fibonacci Channel Up you see on this chart.
The index has established the 1day MA50 as the new long term Support and may test it soon if we expect it follow a similar course as the October-November 2022 rally, which made a short term pull back after rising by +12.20%.
That pull back happened after reaching the 0.618 Fibonacci level and declined slightly under the 0.382. Typical technical retrace. It then resumed the rally to complete a +17.30% rise.
Buy that pull back as it will most likely be the last before Santa's rally to +17.30%. Target 4800.
Note: The price is currently on the same 1day CCI level as October 25th.
Follow us, like the idea and leave a comment below!!

Market Trending Up, but what about longer trends?Hey everyone! Sorry for being away for a bit, while we did follow my red graph down and I had shorted into some of that, I did not feel comfortable following it back up and went over to trade several 6E contracts instead. Not sure the income difference was much, but it felt like a safer trade following long term valuation of the Euro than hoping stocks regain levels never until the pandemic.
Full disclosure, I closed out my 6E contracts towards the end of Tuesday, and am sitting in NO current position right now, so it is easy for me to talk about the market with no skin in the game.
That being said, let's dive into things. Here are the trends as we are in the middle of today;
Last Macro Trend Signal Spots (ESZ Contract)
30m - 4524 Uptrend (11/16/2023) Higher High
1Hr - 4391 Uptrend (11/10/2023) Higher High
2Hr - 4412 Uptrend (11/10/2023) Higher High
3Hr - 4412 Uptrend (11/10/2023) Higher High
4Hr - 4424 Uptrend (11/10/2023) Higher High
6Hr - 4260 Uptrend (11/1/2023) Lower High
12Hr - 4319 Uptrend (11/2/2023) Lower High
Daily - 4378 Uptrend (11/3/2023) Higher High
Weekly - 4244 Downtrend (10/16/2023) Lower Low
On a short term and medium-term basis, things are very much trending upward. Based on the short sentiment in the market, I think we won't push too much higher, and could even run back down to around 4420ish as I think lots of people went short going into Tuesday's CPI data and are going to be holding their positions to try and minimalize their losses if they didn't practice good risk management.
I go into a concern on this upward movement in the video, but ultimately I am concerned that we had our first lower low downtrend EVER on a Weekly analysis for trends. I'm not saying that it will take us lower, I am saying it has never happened before. Every downtrend signal we ever had prior has always been a higher low downtrend. As long as we stay above 4462 when the last uptrend signaled (week of June 6, 2023) we are above and looking to signal a higher high uptrend, but anything below that to me shows we could be headed into a sideways or even long term downtrend market for the first time ever. Or... like I said it has never happened so maybe it means nothing, as there is no historical data to look at.
My current outlook is;
I just plan to sit and watch for potentially the rest of this week and maybe decide Monday on a position, unless I take a short term trade for just over Friday but will likely close out before the weekend. I may even continue to look for other areas of the market to invest in.
Safe trading, and remember your risk management plan!

Dow Jones Index (US30): Important Update After Payrolls Report
Multiple time frame analysis for Dow Jones Index.
Bearish outlook explained.
Important key levels & price action analysis.
❤️Please, support this video with like and comment!❤️

Dow Jones Index (US30): Your Trading Plan Explained
Daily/4h/1h time frames analysis for Dow Jones.
Price action & key levels.
Trading plan explained.
SMC outlook.
❤️Please, support this video with like and comment!❤️

Bulls and Bears zone for 11-15-2023After a Huge rally yesterday, futures are trading around yesterday's High.
Any test of yesterday's HIGH could provide direction for the day.
Level to watch: 4522 --- 4524
Reports to watch:
US: Business Inventories
10:00 AM ET
US:EIA Petroleum Status Report
10:30 AM ET

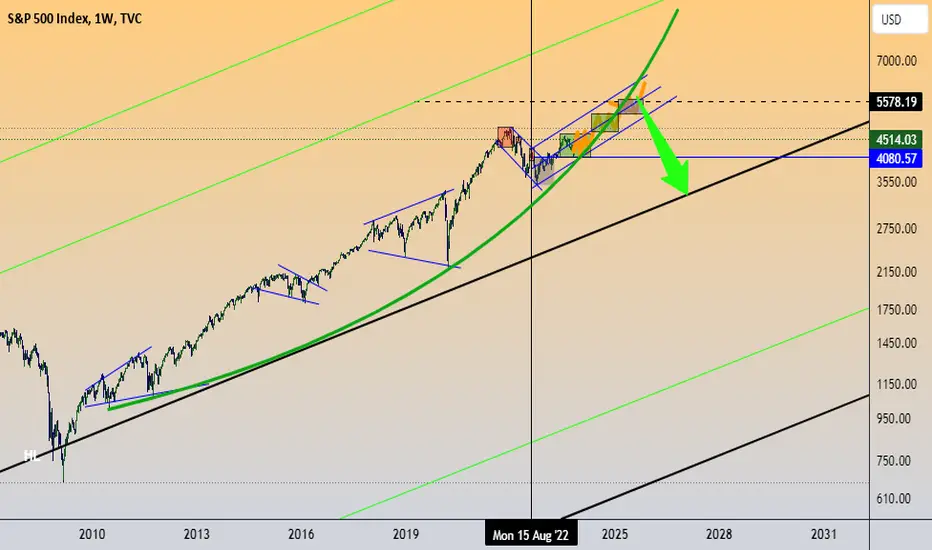
SNP500 & My BIG SHORT - Recession TradeSPX is destined to drop hard, back to 2009 lows.
I decided to go short, to catch the next Market Crash.
It's the previous Wave 4 of a lesser degree.
If you know Elliott Wave as I do, then you are getting ready too.
In my opinion SPX500USD has topped a Wave 5 of a large degree.
More info on that in my Full Wave Count for that 150y old chart.
Here's a picture on that SPX500 / US500 Monthly Chart:
Now, what are the main reasons behind my BIG SHORT on US500.F ?
1. The Volatility Index (VIX) is showing a Fractal, the 2007-2009 same/exact sequence.
2. The United States Consumer Confidence Index (USCCI) is telling me that Consumers are entering the Fear Period.
3. The Federal Reserve Funds Rate (FEDFUNDS / FRED) has broken out of an important Downtrend.
4. The US Inflation Rate (USIRYY) is saying that a full-blown war has started.
5. The 10y Treasury Note Yield (TNX) just broke out of a 40y Downtrend.
6. The US 10y Government Bonds (US10 / US10Y / USB10YUSD) finalized a big bearish leg.
7. The Crypto Market Cap (TOTAL) & Bitcoin (BTCUSD) : The Golden King is taking over.
I know what you might be thinking: SPXUSD could actually do one last Bullish move, an overshoot in the last of the last 5th, right?
In this case, the Wave Count on ES1! could be one step behind, and the Impulse Extension in the 5th of 5th was left out.
Yes, that could be a scenario as well, and I will get burnt.
However, I do not think that's the case, so I am loading my Shorts on SPX500USD !
I could not help but noticing that SPX500 is doing the same Fractal Sequence it did on the previous 2007-2009 Recession.
My Sell Orders & Trading Signals on the SPX Market Crash:
* Aggressive Entry: @ Market Price ($3960)
* Moderate Entry: @ $4500 with SL @ 4900
* Conservative Entry: @ 4700.0 with SL @ 5400
* Position Trading: Sell Stop @ 3700.0 with SL @ 4800.0
* Targets @ : $3200 / $2750 / $2500 / $2200 / $1800 / $1400 / $1100
* Safety measures: when in the green, moving SL @ BE.
Good luck and many pips ahead!
Richard, the Wave Jedi.

S&P500 Cup and Handle paid off. Now brace for Xmas rally.The S&P500 index (SPX) fulfilled our previous Cup and Handle (C&H) pattern, as even though it had a week closing below the 1W MA50 (blue trend-line), it eventually bottomed and has since been on a 3-week rebound that broke above the Handle, turning the 1D MA50 (red trend-line) into a Support again.
Perhaps the strongest technical development of the week is the emerging formation of a Bullish Cross on the 1W MACD. Historically those are formed in the middle of strong rallies, even during a Bear Cycle correction (such as on July 18 2022). Even though a 1 week correction similar to the October 31 2022 1W candle is possible, we expect a new All Time High (ATH) at 4900 (Target 2) at least, as every rally since the October 10 2022 market bottom, has completed at least a +20.19% rise.
Even on the short-term, we expect a 'Christmas rally' to test the bottom of the ATH Zone at 4700 by the end of December, assuming the 1D MA50 of course supports.
Our longer term perspective has the psychological 5000 target in frame as it is slightly below the 1.5 Fibonacci extension from the July 24 High. This projection is made based on that July 24 High itself, which was been on the 1.5 Fib extension from the January 30 High.
Are you looking for a 1 week pull-back to buy or you are already on board for a 'Santa rally'?
-------------------------------------------------------------------------------
** Please LIKE 👍, FOLLOW ✅, SHARE 🙌 and COMMENT ✍ if you enjoy this idea! Also share your ideas and charts in the comments section below! This is best way to keep it relevant, support us, keep the content here free and allow the idea to reach as many people as possible. **
-------------------------------------------------------------------------------
💸💸💸💸💸💸
👇 👇 👇 👇 👇 👇

ES range for 14-Nov [ETH Update]Capitalize on the around-the-clock liquidity of E-mini S&P 500 futures (ES), and take advantage of one of the most efficient and cost-effective ways to gain market exposure to the S&P 500 Index, a broad-based, capitalization-weighted index that tracks 500 of the largest companies of the US economy and a key indicator of the stock market’s health. With ES futures, you can take positions on S&P 500 performance electronically.

S&P500: Over July's Channel Down. Big bullish breakout.S&P500 crossed over the Channel Down that started in late July, turned bullish on the 1D technical outlook (RSI = 60.269, MACD = 21.240, ADX = 31.244) and ahead of the U.S. CPI report is targeting the R2 level. If today's 1D candle closes over the top of the Channel Down, aim at the R2 without a pullback (TP = 4,530). If it closes under it, buy after a pullback near the 1D MA50, with the same target.
Long term, we are targeting the 2.0 Fibonacci extension (TP = 4,690), as this is the technical target of the Inverse Head and Shoulders pattern, which was validated by the 1D RSI Double Bottom on October 27th.
See how our prior idea has worked:
## If you like our free content follow our profile to get more daily ideas. ##
## Comments and likes are greatly appreciated. ##

SP500 Santa RallyIf you check our previous post on the SP500 here you'll see we called the top of the B wave in back in July and since then we've moved down in a leading diagonal to complete wave 1 of C, now we're in the middle of a sharp and fast wave 2 and we believe Friday just gone marked the top of the A wave of this wave 2, we're expecting a pretty quick decline for the B wave followed by a sharp rise to complete wave C of 2 in time for the 'santa rally' but we expect things to start turning sour pretty quickly as the new year approaches and this wave 3 of the larger wave C down will get nasty, very fast. So be sensible if you are looking to go long for the santa rally, don't get caught out with your pants down trying to squeeze every ounce of profit out of this counter trend rally, because when this turns, it's going to turn very quickly and will take no prisoners.

Weekly Update: Fire is MesmerizingAs we continue to subdivide within this larger cycle wave a down targeting the low 3,000 area, we appear to find ourselves in a countertrend b-wave retracement. This area has the potential to carve out potential complex patterns as b-waves and wave 4's are the areas where traders are frustrated from a sentiment standpoint.
I do not think we should be prepared for an easy consolidation and additionally, I believe we could be for a while. Within this area price should behave within a range. It would not be uncommon to experience irregular corrective patterns that slightly exceed previous highs or lows. As a Pattern Analyst I have no mechanism to forecast these sub-divisions.
My main reason I believe we stay contained within a range is based entirely on 2 aspects of data. (1) we have retraced much higher than in standard form, and (2) The IWM just completed it's b-wave triangle, and if recent history is any guide when comparing small caps to large caps is there appears to be 1-3 month lag in the broader markets. See my small cap analysis here .
Nonetheless, what comes next is a c-wave. If you have followed me for a while, you'll know a c-wave down feels like a crash. I'm not saying the stock markets are about to crash...I'm simply saying that soon if you find yourself saying out loud, "This feels like the stock market is crashing" ...that's how you know you're in a c-wave.
Are the bulls playing with fire here? My mom always told me that fire is mesmerizing, but don't you dare touch it.
Best to all,
Chris

Bulls and Bears zone for 11-09-2023Last several days market has been rallying. However, last few sessions traders seem to be selling in the afternoon session.
Level to watch 4395 --- 4393
Report to watch:
US:EIA Natural Gas Report
10:30 AM ET
US: Jerome Powell Speaks
2:00 PM ET

Weekly Update: Do Small Caps Still Lead the Broader Markets?We've all heard that the small capitalized publicly traded companies lead the larger cap companies, more so featured in the broader indices. A quick look back shows the Small Caps Topped in November 2021, whereas the Nasdaq and SP500 did not top till January 2022. Subsequently, the IWM bottomed in June of 2022, and it took the NDX and SPX till October of 2022 to form a bottom.
So it appears we do not have to go back too far to see this phenomenon is still valid. If this price action of leading the broader markets continues to persist, then the IWM is now poised to literally "Drop like Rock".
A quick observation shows the small caps are around their lows bouncing slightly for wave 2 in our primary c-wave down. You can read my prior posts on the SPX and NDX indices but it appears if you want to know if the recent bullish feeling rally in the DJIA, NDX and SP500 has sustainable legs...look no further than the IWM.
Best to all,
Chris

S&P500 Total Return Index: Reading Market Between the LinesThe 1st half-year of 2023 is near the end, so the June Triple Witch quarterly expiration on the financial markets just took place the business day before.
The S&P500 index ( SP:SPX ) has added 14.44% in net prices since the beginning of 2023 and 15.36% in its total returns ( SP:SPXTR ), back to levels above 4,400 that were not seen in the past 12 months since the second quarter of 2022.
Historical backtest analysis indicates that the result achieved by SP:SPX Index year-to-date is the second largest in the last 25 years, second only to the pre-Covid 2019, where the return of the S&P500 index was 19.12% by mid-June (net prices) and 20.30% (total return).
This publication proposes to dwell in more detail on the definition and formula for calculating so-called market "Total Return", when measuring the performance of financial markets.
As no single idea has been published for the S&P 500 Total Return Index ( SP:SPXTR ) neither on any local version, nor on the International version of the TradingView , to the author's surprise..
So.. Let's be the first 😀
What is Total Return, or "Total Return"?
In general, the Total Return is the actual value (or rate) of profit from investments for a certain evaluation period.
Total return in certain markets includes various categories: accrued interest (accrued interest in bond markets), capital gains (paper P/L based on the change in the market price of an asset), dividends, as well as other mandatory distributions due to regulation, for a certain period of time.
Main conclusions
👉 Total return is the actual return on an investment or basket of investments over a given period of time.
👉 Total return includes interest, capital gains, dividends and distributions, calculated as a percentage of the amount invested.
👉 Total return has a stronger performance vs. Net prices performance, when the amounts that an investor earns on a security over a certain period (in the form of interest, dividends and distributions) are reinvested back into the purchase of additional securities, making higher investment returns over time, according to the principle of compound interest.
👉 Total return are more important when investing in dividend stocks/value investment assets, which have generally low capital appreciation potential relative to Growth assets. But still often outperform them, following a long-term capital reinvestment strategy.
👉 The total return can be formed by the investor both individually, that is through the purchase of additional securities (for the amounts of received interest, dividends and distributions), as well as through mutual and exchange trade funds (ETFs). Of course, bearing in mind and taking into account significant risks, common to all collective investment schemes.
Average annual total return
It is important to analyze the average annual total return for different periods. Comparison of returns against a benchmark of the risk-free rate and inflation shows how efficient or inefficient the issuer of the security has been vs risk-free investments (for example, banking deposits).
When analyzing the average annual total return, it is also important to remember:
👉 Even small discrepancies in the average annual returns on Net prices and Total return prices over time will significantly affect the overall result.
👉 The influence of commissions and exchange fees is also large, despite the fact that they often look like a small amount of a few tenths or hundredths of a percent.
Examples and General Meaning of Net Price Returns and "Total Returns"
👉 At 2.08 percent of the average annual dividend yield of the S&P500 Index over the past 35 years, the return of the corresponding "full return" index SP:SPXTR amounted to 35.98x during this time, while the net price index SP:SPX added only 17.11x, more than 2x down vs yielding of the reinvestment strategy.
👉 Full return reinvestment strategies are important in conditions where financial markets and securities are long-term settling in in wide price (zone) ranges, due to unfavorable or modest general market (macroeconomic) conditions that pushing down stock market and capital growth - for example like in the past 12 - 24 months in SPX as a result of upgoing inflation and Fed interest rates.

S&P500 and VIX. A tale of two opposites.It's no secret that the stock market and in this particular example, the S&P500 (chart on the left), is negatively correlated to the Volatility Index (chart on the right). What we do want to bring to your attention however is how tightly this correlation has been in the past 12 months with VIX's Falling Wedge having the price on its middle, almost on perfect symmetry with the S&P's Bullish Megaphone.
See the recurring sequences within both patterns (tops/ red, bottoms/ greens, consolidations/ blue arcs) and how inversely correlated they are. Right now VIX is headed for its Support where it ends to rebound and consolidate for around 1 month, before sharply declining for a new Lower Low.
Similarly we expect the S&P500 to rise some more before peaking for the short-term, then pull-back to consolidate and then stage an aggressive end-of-the-year rally. Can it repeat a +20% rally as the previous 2 rally legs of the past 12 months? Doubtful, but potentially taking profits when VIX bottoms is certainly a good indicator to have in mind.
-------------------------------------------------------------------------------
** Please LIKE 👍, FOLLOW ✅, SHARE 🙌 and COMMENT ✍ if you enjoy this idea! Also share your ideas and charts in the comments section below! This is best way to keep it relevant, support us, keep the content here free and allow the idea to reach as many people as possible. **
-------------------------------------------------------------------------------
💸💸💸💸💸💸
👇 👇 👇 👇 👇 👇

S&P500 Over the 1day MA50 but short term sell opportunityThe S&P500 index / US500 broke and closed over the 1day MA50 on Friday, for the first time in almost 2 months.
Even though it is a major long term bullish development, we see a short term sell opportunity as the 1day RSI is reversing, signalling a loss of strength on the 5 day rally.
The long term pattern remains a Bearish Megaphone, so such minor technical correction is justified.
Sell and target 4270 (Fibonacci 0.382, a level always reached inside the Megaphone's corrections).
Follow us, like the idea and leave a comment below!!

ES range for 06-Nov [RTH Update]Capitalize on the around-the-clock liquidity of E-mini S&P 500 futures (ES), and take advantage of one of the most efficient and cost-effective ways to gain market exposure to the S&P 500 Index, a broad-based, capitalization-weighted index that tracks 500 of the largest companies of the US economy and a key indicator of the stock market’s health. With ES futures, you can take positions on S&P 500 performance electronically.

ES/MES range for 06-Nov [European Session Update]Capitalize on the around-the-clock liquidity of E-mini S&P 500 futures (ES), and take advantage of one of the most efficient and cost-effective ways to gain market exposure to the S&P 500 Index, a broad-based, capitalization-weighted index that tracks 500 of the largest companies of the US economy and a key indicator of the stock market’s health. With ES futures, you can take positions on S&P 500 performance electronically.

ES 4H Analysis ES experienced a remarkable surge in the past week. However, we've returned to the crucial breakout and retest range of 4400-4430. For the rally to persist, it would be ideal for ES to have a moderate retracement and maintain demand in the vicinity of 4325-4340. While the price might continue its upward trajectory without a pullback, a measured retracement would be a positive sign. It's essential to remember that we remain in a declining channel and are approaching a vital zone characterized by the breakout, retest, and trendline resistance. Anticipate inconsistent and sluggish price movements (cooling period) before either a continuation or a reversal.
Key levels to monitor:
Resistance: 4400-4430
Support: 4325-4340

US500 ~ November TA Outlook (4H Intraday)CAPITALCOM:US500 chart mapping/analysis.
Ripping bounce off lower range of descending parallel channel (white) into upper range of Golden Fib Ratio (66% Fib / ~4370).
TBC consolidation/retracement for further bullish momentum to re-test upper range of parallel channel, or bearish continuation of downward trend.

ES/MES range for 06-NovES/MES range for 06-Nov
Capitalize on the around-the-clock liquidity of E-mini S&P 500 futures (ES), and take advantage of one of the most efficient and cost-effective ways to gain market exposure to the S&P 500 Index, a broad-based, capitalization-weighted index that tracks 500 of the largest companies of the US economy and a key indicator of the stock market’s health. With ES futures, you can take positions on S&P 500 performance electronically.

S&P 500: Bulls at the Helm 📈🐂The S&P 500 has risen significantly since yesterday and has broken through resistance at 4294. We must now assume that the low of wave in magenta was already established a few days ago, on October 27th. Going forward, we can expect a continuation of the rally that has now begun, which should also continue above the resistance at 4634 in the course of the magenta wave .
