Day Trade Market Condition sep 26, 2023Day Trade Market Condition sep 26, 2023
levels for NQ ES CL BTC
watch the table left side for trade, right side for trend
Es1

Weekly Update: Why is the Street Asleep at the Wheel?Post 2009 Financial Crisis, they made movies about the housing and economic downturn. Here’s the thing, there are over 10M financial advisors, money managers, hedge fund managers, and fundamental and technical analysts in the industry. This doesn’t include the geniuses in the Financial News business. However, why did only a hand full of that total population (less than a dozen) see the SPX dropping 60% from 1587 to 666 in a matter of 5 months?
Did you watch the movies?
Because the reason was on average, housing has always been a 3-5% asset yielding per year over the long term. There was no way the housing market was going to crash. 10M smart people and only a dozen got it right? What does that say about the other 9.999M smart people in the industry?
No, I’m not writing about how I am smarter than 10M professionals in the industry, but you have to admit, by and large, EVERYONE IN THE INDUSTRY got it wrong. It's easy to manage money when the market just goes up for 100 years...what about when that is no longer the case. During the very long cycle paradigm shifts, the old norms no longer apply.
In my opinion, they’re cranking up the ignorant train once again. I’ll attempt to over simply this.
INTEREST RATE REVERSION TO THE MEAN
Most market participants are not used to interest rates at 10%...I on the other hand, used to think 10% was competitive. But long-term cycles being what they're are, their purpose is to clean the slate, re-educate participants, get rid of the old and welcome the new, all while reverting back to an equilibrium or a cycle norm.
I'm curious when the street will stop discussing soft landing, no landing, higher for longer, etc. Start concerning themselves with how our economy looks and functions next year, the year after that, and 5 years from now in a long-term rising interest rate environment. I have a feeling the 10M in the financial services industry will shrink, and those smart people, will have get a lot smarter to survive.

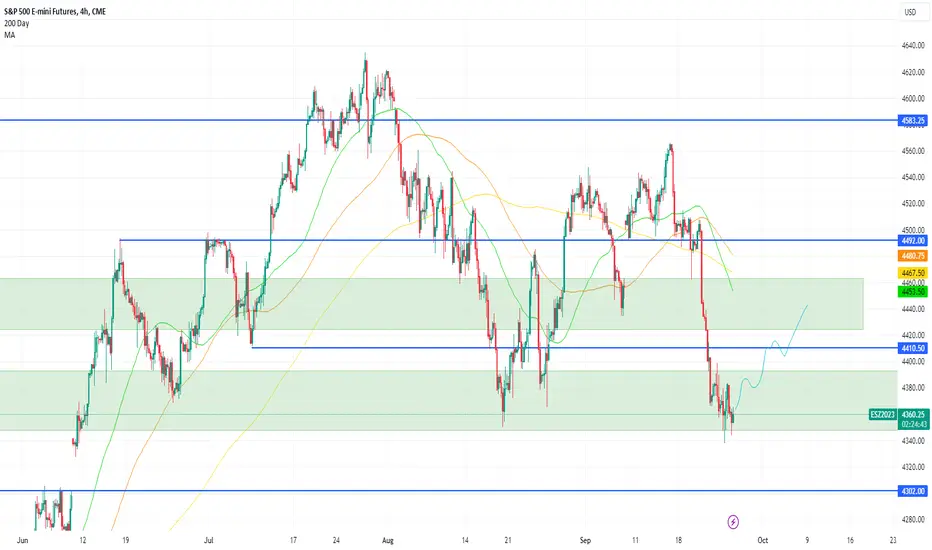
S&P Could find support here Following a notable correction, the S&P index may find support at its current level, particularly if the lower boundary of the green box at 4,350 holds. In the event of a successful hold, we could potentially witness a rally towards the initial target of 4,410. Subsequently, after a consolidation phase, a further move towards a level around 4,440 could be in the cards.
However, it's crucial to be aware that should the support within the green box fail, we may witness a decline towards the 4,300 mark.
SP500 Has An Unfinished A-B-C Structure; Elliott Wave AnalysisSP500 has been bullish most of the year; a trend that can resume after a corrective pullback that is underway now, seen in wave 4 on a daily chart. However, wave 4 should then be made by three waves before correction can come to an end; which is not the case yet, as price action down from 4600 can be ongoing impulse; ideally sub wave 3 of (C) now, so more weakness for wave 5 of (C) is probable to 4300 after a wave 4 pullback that can retest 4400 resistance area.

S&P500: Near the bottom. Recovery should start early October.S&P500 is trading on a descending channel, on a very bearish 1D technical outlook (RSI = 36.220, MACD = -31.420, ADX = 38.889). The 1D RSI is on the same level as the August 17th bottom of this Channel Down. This decline is approaching a Triple Support Band: the 1D MA200 and the 1W MA50 which are headed directly for the bottom of the Channel Up that started exactly a year ago.
We expect the bottom to be formed inside these two weeks and early next month to see the first signs of recovery. A Cup recovery pattern has been the common mode of rise these past 12 months, so we set a R1 target (TP = 4,600) for mid to end of November.
## If you like our free content follow our profile to get more daily ideas. ##
## Comments and likes are greatly appreciated. ##

Trading Plans for MON. 09/25 - Market Bull Exhausted?S&P 500 INDEX MODEL TRADING PLANS for MON. 09/25
As our daily trading plans reinforced before the FOMC meeting stated: "...any indications of the Fed potentially pivoting to "being done" can spark a frenzied rally in the coming weeks but any unexpectedly hawkish indications could further accelerate the downward push. Nobody has the crystal ball that can tell which way this could go until after the FOMC meeting". The unexpectedly hawkish Fed stance drove the markets down and continuing to push it lower.
Our published trading plans on Friday, 09/15 stated: "Models continue to indicate that the index has to close above 4507 on a daily close basis to flip to a bullish bias. Between 4460 and 4507, models indicate an indeterminate bias". This week's 4505 level could be the top for the near term. A daily close above 4404 is needed for our models to turn bullish again.
Aggressive, Intraday Trading Plans:
For today, our aggressive intraday models indicate going long on a break above 4354, 4332, 4324, 4315, or 4304 with a 9-point trailing stop, and going short on a break below 4350, 4329, 4321, or 4302 with a 9-point trailing stop.
Models indicate explicit long exits on a break below 4313. Models also indicate a break-even hard stop once a trade gets into a 4-point profit level. Models indicate taking these signals from 11:01am EST or later.
By definition the intraday models do not hold any positions overnight - the models exit any open position at the close of the last bar (3:59pm bar or 4:00pm bar, depending on your platform's bar timing convention).
To avoid getting whipsawed, use at least a 5-minute closing or a higher time frame (a 1-minute if you know what you are doing) - depending on your risk tolerance and trading style - to determine the signals.
(WHAT IS THE CREDIBILITY and the PERFORMANCE OF OUR MODEL TRADING PLANS over the LAST WEEK, LAST MONTH, LAST YEAR? Please check for yourself how our pre-published model trades have performed so far! Seeing is believing!)
NOTES - HOW TO INTERPRET/USE THESE TRADING PLANS:
(i) The trading levels identified are derived from our A.I. Powered Quant Models. Depending on the market conditions, these may or may not correspond to any specific indicator(s).
(ii) These trading plans may be used to trade in any instrument that tracks the S&P 500 Index (e.g., ETFs such as SPY, derivatives such as futures and options on futures, and SPX options), triggered by the price levels in the Index. The results of these indicated trades would vary widely depending on the timeframe you use (tick chart, 1 minute, or 5 minute, or 15 minute or 60 minute etc.), the quality of your broker's execution, any slippages, your trading commissions and many other factors.
(iii) These are NOT trading recommendations for any individual(s) and may or may not be suitable to your own financial objectives and risk tolerance - USE these ONLY as educational tools to inform and educate your own trading decisions, at your own risk.
#spx, #spx500, #spy, #sp500, #esmini, #indextrading, #daytrading, #models, #tradingplans, #outlook, #economy, #bear, #yields, #stocks, #futures, #inflation, #recession, #softlanding, #FOMC

Day Trade Market Condition sep 25, 2023Day Trade Market Condition sep 25, 2023
levels for NQ ES CL BTC
watch the table left side for trade, right side for trend
Trend ES Bearish NQ on the edge this week if dip below, CORRECTION on its way

Dow Jones Index (US30): Breakout & Important Zone to Watch
Last week, we saw 2 important structure breakouts on US30:
first, the market violated a major rising trend line,
then, on Friday, a key horizontal support was also broken.
The broken trend line and a horizontal structure compose the expanding supply zone now.
I will expect a bearish reaction to that and a bearish movement to 33750 support.
❤️Please, support my work with like, thank you!❤️

US500 ~ 1H Intraday Chart (Sept-Oct)CAPITALCOM:US500 chart mapping/analysis for short-term & intraday trades.

Is this the end of the Google stock downtrend ?Hello ladies and gentleman ,According to my analysis of GOOGLE stock , I traced 2 strong level which was the point of the stock bullish run as you see in the chart ,But for the moment we don't have a clear confirmation for a trend reversal .So ,in the coming days we may see some changes that can affect this stock , There is a big bearish volume .
we can rely on the divergence in Rsi , we have to give big place for fundamentals now ,a lot of changes are happening ,that's what I THINK we must focus on to get a better results
I hope you appreciate my analysis ,If you have any suggestions ,please write it below to discuss it.

Dow Jones Index (US30): Important Breakout & Bearish Outlook
An important thing happened on US30 Index.
First, the index broke and closed below a major rising trend line
and closed below that on a daily.
Second, a key horizontal support was also broken yesterday.
The broken support and a trend line compose the expanding sell zone.
I suggest shorting the Index from there, expecting a fall to 33700 support.
❤️Please, support my work with like, thank you!❤️

Markets' Mind Still on the Hawkish FedS&P 500 INDEX MODEL TRADING PLANS for FRI. 09/22
As our daily trading plans reinforced before the FOMC meeting yesterday: "...any indications of the Fed potentially pivoting to "being done" can spark a frenzied rally in the coming weeks but any unexpectedly hawkish indications could further accelerate the downward push. Nobody has the crystal ball that can tell which way this could go until after the FOMC meeting". The unexpectedly hawkish Fed stance drove the markets down and continuing to push it lower this morning.
Our published trading plans on Friday, 09/15 stated: "Models continue to indicate that the index has to close above 4507 on a daily close basis to flip to a bullish bias. Between 4460 and 4507, models indicate an indeterminate bias". This week's 4505 level could be the top for the near term. A daily close above 4440 is needed for our models to turn bullish again.
Aggressive, Intraday Trading Plans:
For today, our aggressive intraday models indicate going long on a break above 4403, 4376, 4365, 4354, or 4342 with a 9-point trailing stop, and going short on a break below 4400, 4361, 4350, 4339, or 4329 with a 9-point trailing stop.
Models indicate explicit long exits on a break below 4332, and explicit short exits on a break above 4369 or 4373. Models also indicate a break-even hard stop once a trade gets into a 4-point profit level. Models indicate taking these signals from 10:31am EST or later.
By definition the intraday models do not hold any positions overnight - the models exit any open position at the close of the last bar (3:59pm bar or 4:00pm bar, depending on your platform's bar timing convention).
To avoid getting whipsawed, use at least a 5-minute closing or a higher time frame (a 1-minute if you know what you are doing) - depending on your risk tolerance and trading style - to determine the signals.
(WHAT IS THE CREDIBILITY and the PERFORMANCE OF OUR MODEL TRADING PLANS over the LAST WEEK, LAST MONTH, LAST YEAR? Please check for yourself how our pre-published model trades have performed so far! Seeing is believing!)
NOTES - HOW TO INTERPRET/USE THESE TRADING PLANS:
(i) The trading levels identified are derived from our A.I. Powered Quant Models. Depending on the market conditions, these may or may not correspond to any specific indicator(s).
(ii) These trading plans may be used to trade in any instrument that tracks the S&P 500 Index (e.g., ETFs such as SPY, derivatives such as futures and options on futures, and SPX options), triggered by the price levels in the Index. The results of these indicated trades would vary widely depending on the timeframe you use (tick chart, 1 minute, or 5 minute, or 15 minute or 60 minute etc.), the quality of your broker's execution, any slippages, your trading commissions and many other factors.
(iii) These are NOT trading recommendations for any individual(s) and may or may not be suitable to your own financial objectives and risk tolerance - USE these ONLY as educational tools to inform and educate your own trading decisions, at your own risk.
#spx, #spx500, #spy, #sp500, #esmini, #indextrading, #daytrading, #models, #tradingplans, #outlook, #economy, #bear, #yields, #stocks, #futures, #inflation, #recession, #softlanding, #cpi, #ppi, #FOMC

Day Trade Market Condition sep 22, 2023Day Trade Market Condition sep 22, 2023
levels for NQ ES CL BTC
watch the table left side for trade, right side for trend
Note the trend on ES/NQ approaching 4376/14718, it attracts buying however enter if price action and volume suggesting

As we Approach the 4307.50 target, a Reminder Seems AppropriateI’ve written about price heading to the mid 4200’s to low 4300’s for a while now. By my count, I’ve written a total of 4 times just in the month of September.
Links below:
Sept 15
Sept 14
Sept 8
Sept 2
The target moved up slightly following the Sept contract change to Dec from 4256 to 4307.50. As the analysis changed, I adjusted my targets. But I must be honest, this has been a difficult pattern to trade so far up till today.
From an educational standpoint, yes, I found some silver linings. Ones in which I feel will end up working in my favor in the future. However, I didn’t decide to write this article to announce to my followers how great of an analyst I am.
I did so to issue a reminder.
When price does finally come into the 4307.50 area…if we bounce impulsively higher in a 5-wave pattern, we may complete an abc correction to the downside and rally for the remainder of 2023.
However, if we breach 4307.50 to the downside for a sustained period of time, and price continues to move through the 4250 level. That is our first big clue (NOT CONFIRMATION) that we’re headed to 3200-3300 MINIMUM IN early to mid 2024...
Just a friendly reminder.
Best to all,
Chris

S&P500 Confirmed sell as it crossed the MA100 (1d).The S&P500 index crossed today under the MA100 (1d) for the first time since March 28th.
Since October 2022, the pattern is a Channel Up and the current decline since the July 27th top still has room to fall before it hits the pattern's bottom.
Trading Plan:
1. Sell on the current market price.
Targets:
1. 4250 (bottom of the Channel Up and potential contact with the MA200 (1d)).
Tips:
1. The bottom's of the long term Channel Up have beem formed when the RSI (1d) completed Lower Lows near or under the 30.00 level. Be ready to book the profit if you see a rebound after the RSI makes a Lower Low.
Please like, follow and comment!!
Notes:
Past trading plan:

Trading Plans for THU. 09/21 - Market Bull Goldilocks No MoreS&P 500 INDEX MODEL TRADING PLANS for THU. 09/21
As our daily trading plans reinforced before the FOMC meeting yesterday: "...any indications of the Fed potentially pivoting to "being done" can spark a frenzied rally in the coming weeks but any unexpectedly hawkish indications could further accelerate the downward push. Nobody has the crystal ball that can tell which way this could go until after the FOMC meeting". The unexpectedly hawkish Fed stance drove the markets down and continuing to push it lower this morning.
Our published trading plans on Friday, 09/15 stated: "Models continue to indicate that the index has to close above 4507 on a daily close basis to flip to a bullish bias. Between 4460 and 4507, models indicate an indeterminate bias". With the index closing just below the lower end of this range (at 4450.32), these levels are still broadly applicable for this week. This week's 4505 level could be the top for the short term, and the 4507 level needs to be broken above for any meaningful bullishness to return to the markets.
Aggressive, Intraday Trading Plans:
For today, our aggressive intraday models indicate going long on a break above 4452, 4421, 4403, or 4376 with a 9-point trailing stop, and going short on a break below 4448, 4435, 4416, 4400, or 4367 with a 9-point trailing stop.
Models indicate explicit long exits on a break below 4373, and explicit short exits on a break above 4440. Models also indicate a break-even hard stop once a trade gets into a 4-point profit level. Models indicate taking these signals from 11:31am EST or later.
By definition the intraday models do not hold any positions overnight - the models exit any open position at the close of the last bar (3:59pm bar or 4:00pm bar, depending on your platform's bar timing convention).
To avoid getting whipsawed, use at least a 5-minute closing or a higher time frame (a 1-minute if you know what you are doing) - depending on your risk tolerance and trading style - to determine the signals.
(WHAT IS THE CREDIBILITY and the PERFORMANCE OF OUR MODEL TRADING PLANS over the LAST WEEK, LAST MONTH, LAST YEAR? Please check for yourself how our pre-published model trades have performed so far! Seeing is believing!)
NOTES - HOW TO INTERPRET/USE THESE TRADING PLANS:
(i) The trading levels identified are derived from our A.I. Powered Quant Models. Depending on the market conditions, these may or may not correspond to any specific indicator(s).
(ii) These trading plans may be used to trade in any instrument that tracks the S&P 500 Index (e.g., ETFs such as SPY, derivatives such as futures and options on futures, and SPX options), triggered by the price levels in the Index. The results of these indicated trades would vary widely depending on the timeframe you use (tick chart, 1 minute, or 5 minute, or 15 minute or 60 minute etc.), the quality of your broker's execution, any slippages, your trading commissions and many other factors.
(iii) These are NOT trading recommendations for any individual(s) and may or may not be suitable to your own financial objectives and risk tolerance - USE these ONLY as educational tools to inform and educate your own trading decisions, at your own risk.
#spx, #spx500, #spy, #sp500, #esmini, #indextrading, #daytrading, #models, #tradingplans, #outlook, #economy, #bear, #yields, #stocks, #futures, #inflation, #recession, #softlanding, #cpi, #ppi, #FOMC

Day Trade Market Condition sep 21, 2023Day Trade Market Condition sep 21, 2023
levels for NQ ES CL BTC
watch the table left side for trade, right side for trend
Note the trend on ES/NQ approaching 4376/14718, it attracts buying however enter if price action and volume suggesting

Day Trade Market Condition sep 20, 2023 FOMCDay Trade Market Condition sep 20, 2023
levels for NQ ES CL BTC
watch the table left side for trade, right side for trend
Note FOMC @2pm EST
with FOMC possible the price edge to the high/low value area has been developing
On Monday idea with layout the week charts

Trading Plans for WED. 09/20 - The Fed Inflation Fight Still On?S&P 500 INDEX MODEL TRADING PLANS for WED. 09/20
While the interest rate decision of the Fed at this week's meeting is a foregone conclusion, it is the semantics of Chair Powell's presser that the markets are going to obsess over. And, for the right reasons, as any indications of the Fed potentially pivoting to "being done" can spark a frenzied rally in the coming weeks but any unexpectedly hawkish indications could further accelerate the downward push. Nobody has the crystal ball that can tell which way this could go until after the FOMC meeting.
Our published trading plans on Friday, 09/15 stated: "Models continue to indicate that the index has to close above 4507 on a daily close basis to flip to a bullish bias. Between 4460 and 4507, models indicate an indeterminate bias". These levels are still broadly applicable.
Aggressive, Intraday Trading Plans:
For today, our aggressive intraday models indicate going long on a break above 4471, 4463, 4452, 4441, or 4426 with a 9-point trailing stop, and going short on a break below 4420, 4437, 4448, 4460, or 4468 with a 9-point trailing stop.
Models indicate explicit long exits on a break below 4434, and explicit short exits on a break above 4433. Models also indicate a break-even hard stop once a trade gets into a 4-point profit level. Models indicate taking these signals from 02:01pm EST or later.
By definition the intraday models do not hold any positions overnight - the models exit any open position at the close of the last bar (3:59pm bar or 4:00pm bar, depending on your platform's bar timing convention).
To avoid getting whipsawed, use at least a 5-minute closing or a higher time frame (a 1-minute if you know what you are doing) - depending on your risk tolerance and trading style - to determine the signals.
(WHAT IS THE CREDIBILITY and the PERFORMANCE OF OUR MODEL TRADING PLANS over the LAST WEEK, LAST MONTH, LAST YEAR? Please check for yourself how our pre-published model trades have performed so far! Seeing is believing!)
NOTES - HOW TO INTERPRET/USE THESE TRADING PLANS:
(i) The trading levels identified are derived from our A.I. Powered Quant Models. Depending on the market conditions, these may or may not correspond to any specific indicator(s).
(ii) These trading plans may be used to trade in any instrument that tracks the S&P 500 Index (e.g., ETFs such as SPY, derivatives such as futures and options on futures, and SPX options), triggered by the price levels in the Index. The results of these indicated trades would vary widely depending on the timeframe you use (tick chart, 1 minute, or 5 minute, or 15 minute or 60 minute etc.), the quality of your broker's execution, any slippages, your trading commissions and many other factors.
(iii) These are NOT trading recommendations for any individual(s) and may or may not be suitable to your own financial objectives and risk tolerance - USE these ONLY as educational tools to inform and educate your own trading decisions, at your own risk.
#spx, #spx500, #spy, #sp500, #esmini, #indextrading, #daytrading, #models, #tradingplans, #outlook, #economy, #bear, #yields, #stocks, #futures, #inflation, #recession, #softlanding, #cpi, #ppi, #FOMC

Bulls and Bears zone for 09-20-2023Yesterday afternoon market recovered after selling off in the morning.
Today is Fed Day and volatility could be high in the afternoon as well.
Level to watch 4502 --- 4504
Report to watch:
US:EIA Petroleum Status Report
10:30 AM ET
US:FOMC Announcement
2:00 PM ET
US: Fed Chair Press Conference
2:30 PM ET

S&P500 Ascending Triangle giving a bottom buy signal.The S&P500 index (SPX) gave us last week an accurate quick buy signal (see chart below) but then got sold-off to a new 3-week Low:
The price hit yesterday during that sell-off the bottom (Higher Lows trend-line) of the Ascending Triangle pattern that is in place since the August 04 High (which created its 4540 top/ Resistance). This is a short-term buy signal and will be confirmed if the 4H MACD completes the emerging Bullish Cross.
The immediate Resistance is the 4H MA50 (blue trend-line) - 4H MA200 (orange trend-line) Zone and the short-term is the Lower Highs trend-line since the September 01 High. That will be our target, aiming at a +1.77% rise (proportionally less than the previous) at 4490.
-------------------------------------------------------------------------------
** Please LIKE 👍, FOLLOW ✅, SHARE 🙌 and COMMENT ✍ if you enjoy this idea! Also share your ideas and charts in the comments section below! **
-------------------------------------------------------------------------------
💸💸💸💸💸💸
👇 👇 👇 👇 👇 👇

S&P500: Channel Down bottom and HL Support cluster. Buy?S&P500 hit today the HL trendline from the August 18th Low, while approaching the bottom of the Channel Down pattern. Despite this short term weakness, the 1D timeframe remains on neutral technicals (RSI = 46.932, MACD = 8.582, ADX = 32.119). This indicates that it may be an opportunity for sideways trading until we see a clear long term trend.
Consequently, we are buyers on this level, expecting a rebound to the top of the Channel Down and the 0.786 Fibonacci level (TP = 4,490).
Prior idea:
## If you like our free content follow our profile to get more daily ideas. ##
## Comments and likes are greatly appreciated. ##

Day Trade Market Condition sep 19, 2023Day Trade Market Condition sep 19, 2023
levels for NQ ES CL BTC
watch the table left side for trade, right side for trend
