Day Trade Market Condition sep 19, 2023Day Trade Market Condition sep 19, 2023
levels for NQ ES CL BTC
watch the table left side for trade, right side for trend
Es1

Day Trade Market Condition sep 18, 2023Day Trade Market Condition sep 18, 2023
levels for NQ ES CL BTC
watch the table left side for trade, right side for trend
Big picture for the week
Both ES/NQ no major change with structure as every single volume profile value higher

S&P500 Normal consolidation within the large Channel Up.S&P500 / US500 is highly volatile these first two weeks of September, trading sideways on a relatively wide margin, using the 1day MA50 as the pivot.
As long as the 1day MA100 supports, this is a similar consolidation that we witnessed after the market's prior bottom inside the 11 month Channel Up.
Both the 1day RSI and MACD indicate that we might be halfway through the consolidation phase.
This volatile trade is far from alarming for the long term, with the 1day MA200 conveniently placed on the Channel's bottom.
We may see the rally taking off at the end of the month. It is a good opportunity to buy and target 4770 (Fibonacci 1.618 extension as the June 16th High).
Previous chart:
Follow us, like the idea and leave a comment below!!

S&P quick Bounce but don't be fooledES made some considerable moves to the downside this week. Now it is time to partially rebalance those scales.
My expectations for the first few days of this week:
Monday-Tuesday-
Upwards retracement with price being pulled upwards by 4553.
Once there I will look for area rejection signs for our next leg down to the 4483.25 target.

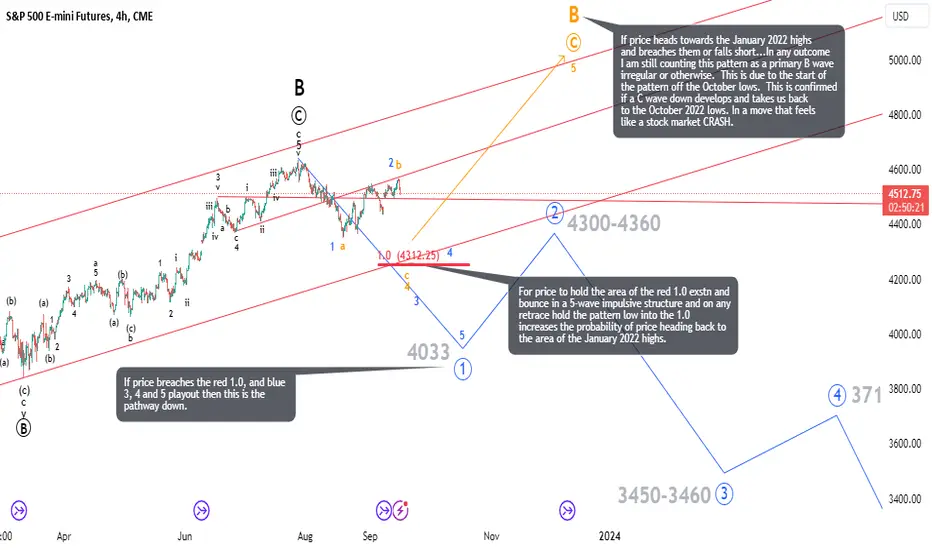
Weekly Update: Strap-In and be PatientToday, we have clearly started our descent down to the low 4300 level. I have posted about this sort of move for a while now. This move to the 4300 level will not happen in a day, nor do I think it will reach my target by next week. However, I do think this will be the type of descent that will not allow for good short entries.
That day has come and gone.
We now track a pattern that is in the very initial stages of carving out a 5-wave structure towards the low 4300. I offer one thing of support to those who are already short. This is now an incomplete wave 1 and should finish today or Monday...but if you think this is swift and scary...wait for wave 3. LOL
Best to all,
Chris
Day Trade Market Condition sep 15, 2023Day Trade Market Condition sep 15, 2023
levels for NQ ES CL BTC
watch the table left side for trade, right side for trend

Trading Plans for THU. 09/14 - PPI and Initial Jobless ClaimsS&P 500 INDEX MODEL TRADING PLANS for THU. 09/14
As of the latest trading plans we published yesterday, Wed. 09/13: "Our models indicate bearish bias for positional trades while the index is below 4470 on a daily close basis. The index has to close above 4507 for our models to abandon the bearish bias".
Just like the CPI numbers yesterday, the PPI numbers and the Initial Jobless Claims this morning came in a way that leaves room for subjective interpretations of being pro-bulls or pro-bears. The pre-session price action following the PPI and Jobless claims numbers this morning prompted our models to update their bias from bearish to neutral/indeterminate. Models continue to indicate that the index has to close above 4507 on a daily close basis to flip to a bullish bias. Between 4460 and 4507, models indicate a neutral/indeterminate bias.
Aggressive, Intraday Trading Plans:
For today, our aggressive intraday models indicate going long on a break above 4487, 4471, or 4450 with a 9-point trailing stop, and going short on a break below 4484, 4467, 4456, or 4448 with a 9-point trailing stop.
Models indicate explicit short exits on a break above 4449. Models also indicate a break-even hard stop once a trade gets into a 4-point profit level. Models indicate taking these signals from 09:31am EST or later.
By definition the intraday models do not hold any positions overnight - the models exit any open position at the close of the last bar (3:59pm bar or 4:00pm bar, depending on your platform's bar timing convention).
To avoid getting whipsawed, use at least a 5-minute closing or a higher time frame (a 1-minute if you know what you are doing) - depending on your risk tolerance and trading style - to determine the signals.
(WHAT IS THE CREDIBILITY and the PERFORMANCE OF OUR MODEL TRADING PLANS over the LAST WEEK, LAST MONTH, LAST YEAR? Please check for yourself how our pre-published model trades have performed so far! Seeing is believing!)
NOTES - HOW TO INTERPRET/USE THESE TRADING PLANS:
(i) The trading levels identified are derived from our A.I. Powered Quant Models. Depending on the market conditions, these may or may not correspond to any specific indicator(s).
(ii) These trading plans may be used to trade in any instrument that tracks the S&P 500 Index (e.g., ETFs such as SPY, derivatives such as futures and options on futures, and SPX options), triggered by the price levels in the Index. The results of these indicated trades would vary widely depending on the timeframe you use (tick chart, 1 minute, or 5 minute, or 15 minute or 60 minute etc.), the quality of your broker's execution, any slippages, your trading commissions and many other factors.
(iii) These are NOT trading recommendations for any individual(s) and may or may not be suitable to your own financial objectives and risk tolerance - USE these ONLY as educational tools to inform and educate your own trading decisions, at your own risk.
#spx, #spx500, #spy, #sp500, #esmini, #indextrading, #daytrading, #models, #tradingplans, #outlook, #economy, #bear, #yields, #stocks, #futures, #inflation, #recession, #softlanding, #cpi, #ppi, #initialjoblessclaims, #joblessclaims

Day Trade Market Condition sep 14, 2023Day Trade Market Condition sep 14, 2023
levels for NQ ES CL BTC
watch the table left side for trade, right side for trend
Caution of FOMO trade happening

Weekly Update: Next Stop 4312.25The rally off the August 18th lows is an overlapping mess that stands a high probability of concluding very soon, if not TODAY.
However, yesterday's CPI report market reaction marked a unique opportunity to remind followers, that markets are not linear. You can choose to look at the CPI report positively through a bullish or bearish lense. The reality was the pattern forming prior to the release was overlapping and signaled traders were uncommitted to higher or lower price action. In my trading room we debated the micro pattern the night before and, in the end, we had nothing constructive to the downside, nor the upside. Therefore, it really didn't matter what the report said, we had no micro pattern pointing us down. The upside was well contained within a larger counter trend rally and that was because we had no impulsive pattern up either.
I commented in my trading room, "Does anyone still feel markets are moved by news or events"?
A hotter than expected CPI discredits the narrative the Fed may be done raising rates. Therefore, one would expect the markets to sell off.
But the opposite happened.
You can choose to embrace any narrative you would like to explain that sort of price action. You can choose to invest or trade based on your personal perspectives…all of those buys and sells create a pattern. In reality, traders were telling us prior to the release...there was indecision about market direction and therefore we remained mired in this consolidation.
But I do think market participants will get the memo shortly. That’s because outside of the micro patterns, the larger patterns are telling us we have a meeting at 4312.25 regardless of your narrative, or perspective.
…and attendance is mandatory. See you all at the meeting.
Best to all,
Chris

S&P500 Short-term buy within the weekly Channel Up.The S&P500 (SPX) hit today the 1H MA200 (orange trend-line) for the first time since September 06, which was before the current 5-day Channel Up pattern. So far it delivers an initial rejection, whose pull-back can extend even below the 1H MA50 (blue trend-line).
Based on the 1H RSI though, which is posting a sequence similar to September 07 - 08, we are close to the reversal point, making it already a buy opportunity. You can confirm that after the price closes a candle above the 1H MA200. Regardless, our target is at the end of a +1.27% increase and the top of the Channel Up at 4500.
-------------------------------------------------------------------------------
** Please LIKE 👍, FOLLOW ✅, SHARE 🙌 and COMMENT ✍ if you enjoy this idea! Also share your ideas and charts in the comments section below! **
-------------------------------------------------------------------------------
💸💸💸💸💸💸
👇 👇 👇 👇 👇 👇

Day Trade Market Condition sep 12, 2023Day Trade Market Condition sep 12, 2023
levels for NQ ES CL BTC
watch the table left side for trade, right side for trend
CPI number making higher volatility this morning, will update after

CPI – Inflation, Disinflation, but No RecessionS&P 500 INDEX MODEL TRADING PLANS for WED. 09/13
Our trading plans published yesterday stated: "Our current bearish bias for positional trading continues, with the bear case appearing a little more plausible in the coming days. It is hard to find what unexpected bullish scenarios could evolve in the near future, so bulls need to be a bit cautious with their current gains. Taking some money off the table could be prudent".
This morning's CPI numbers have something for everyone, leaving room for both bulls and bears to adapt them to their case. Immediately after the release, yields spiked up, but then fell back down...essentially leaving everything open to one's own interpretation. It remains to be seen if tomorrow's PPI numbers will be any more clarifying than that.
Our models indicate bearish bias for positional trades while the index is below 4470 on a daily close basis. The index has to close above 4507 for our models to abandon the bearish bias.
Aggressive, Intraday Trading Plans:
For today, our aggressive intraday models indicate going long on a break above 4487, 4480, 4465, or 4450 with a 9-point trailing stop, and going short on a break below 4485, 4475, 4456, or 4448 with a 9-point trailing stop.
Models indicate explicit long exits on a break below 4463, and short exits on a break above 4459. Models also indicate a break-even hard stop once a trade gets into a 4-point profit level. Models indicate taking these signals from 09:31am EST or later.
By definition the intraday models do not hold any positions overnight - the models exit any open position at the close of the last bar (3:59pm bar or 4:00pm bar, depending on your platform's bar timing convention).
To avoid getting whipsawed, use at least a 5-minute closing or a higher time frame (a 1-minute if you know what you are doing) - depending on your risk tolerance and trading style - to determine the signals.
(WHAT IS THE CREDIBILITY and the PERFORMANCE OF OUR MODEL TRADING PLANS over the LAST WEEK, LAST MONTH, LAST YEAR? Please check for yourself how our pre-published model trades have performed so far! Seeing is believing!)
NOTES - HOW TO INTERPRET/USE THESE TRADING PLANS:
(i) The trading levels identified are derived from our A.I. Powered Quant Models. Depending on the market conditions, these may or may not correspond to any specific indicator(s).
(ii) These trading plans may be used to trade in any instrument that tracks the S&P 500 Index (e.g., ETFs such as SPY, derivatives such as futures and options on futures, and SPX options), triggered by the price levels in the Index. The results of these indicated trades would vary widely depending on the timeframe you use (tick chart, 1 minute, or 5 minute, or 15 minute or 60 minute etc.), the quality of your broker's execution, any slippages, your trading commissions and many other factors.
(iii) These are NOT trading recommendations for any individual(s) and may or may not be suitable to your own financial objectives and risk tolerance - USE these ONLY as educational tools to inform and educate your own trading decisions, at your own risk.
#spx, #spx500, #spy, #sp500, #esmini, #indextrading, #daytrading, #models, #tradingplans, #outlook, #economy, #bear, #yields, #stocks, #futures, #inflation, #recession, #softlanding, #cpi

Bulls and Bears zone for 09-13-2023Yesterday’s trading reflects market's growing short-term lack of interest towards a rally.
Traders might want to test numbers such as 4500.
Level to watch 4510 --- 4512
Report to watch:
US:EIA Petroleum Status Report
10:30 AM ET

S&P500: Formed new bottom. Expecting a rise.The S&P500 index has hit the 0.382 Fibonacci level after a 4H Golden Cross that turned the 4H technical outlook bullish (RSI = 59.782, MACD = 9.210, ADX = 36.280). As mentioned before, this is the same fractal of December 2022 to January 2023. Holding the 0.382 was key to sustaining a rise to the 1.236 Fibonacci extension. We remain bullish on S&P500, targeting the current 1.236 Fibonacci (TP = 4,670).
Prior idea:
## If you like our free content follow our profile to get more daily ideas. ##
## Comments and likes are greatly appreciated. ##

Day Trade Market Condition sep 12, 2023Day Trade Market Condition sep 11, 2023
levels for NQ ES CL BTC
watch the table left side for trade, right side for trend
Trading Z contract for NQ/ES

Trading Plans for TUE. 09/12 - Spikey Consolidation, ContinuedS&P 500 INDEX MODEL TRADING PLANS for TUE. 09/12
Our current bearish bias for positional trading continues, with the bear case appearing a little more plausible in the coming days. It is hard to find what unexpected bullish scenarios could evolve in the near future, so bulls need to be a bit cautious with their current gains. Taking some money off the table could be prudent.
Our models indicate bearish bias for positional trades while the index is below 4470 on a daily close basis. The index has to close above 4507 for our models to abandon the bearish bias.
Aggressive, Intraday Trading Plans:
For today, our aggressive intraday models indicate going long on a break above 4490, 4473, or 4450 with an 8-point trailing stop, and going short on a break below 4487, 4478, 4463, or 4448 with a 9-point trailing stop.
Models indicate explicit long exits on a break below 4470, and short exits on a break above 4481 or 4466. Models also indicate a break-even hard stop once a trade gets into a 4-point profit level. Models indicate taking these signals from 10:36am EST or later.
By definition the intraday models do not hold any positions overnight - the models exit any open position at the close of the last bar (3:59pm bar or 4:00pm bar, depending on your platform's bar timing convention).
To avoid getting whipsawed, use at least a 5-minute closing or a higher time frame (a 1-minute if you know what you are doing) - depending on your risk tolerance and trading style - to determine the signals.
(WHAT IS THE CREDIBILITY and the PERFORMANCE OF OUR MODEL TRADING PLANS over the LAST WEEK, LAST MONTH, LAST YEAR? Please check for yourself how our pre-published model trades have performed so far! Seeing is believing!)
NOTES - HOW TO INTERPRET/USE THESE TRADING PLANS:
(i) The trading levels identified are derived from our A.I. Powered Quant Models. Depending on the market conditions, these may or may not correspond to any specific indicator(s).
(ii) These trading plans may be used to trade in any instrument that tracks the S&P 500 Index (e.g., ETFs such as SPY, derivatives such as futures and options on futures, and SPX options), triggered by the price levels in the Index. The results of these indicated trades would vary widely depending on the timeframe you use (tick chart, 1 minute, or 5 minute, or 15 minute or 60 minute etc.), the quality of your broker's execution, any slippages, your trading commissions and many other factors.
(iii) These are NOT trading recommendations for any individual(s) and may or may not be suitable to your own financial objectives and risk tolerance - USE these ONLY as educational tools to inform and educate your own trading decisions, at your own risk.
#spx, #spx500, #spy, #sp500, #esmini, #indextrading, #daytrading, #models, #tradingplans, #outlook, #economy, #bear, #yields, #stocks, #futures, #inflation, #recession, #softlanding
