Es1
MES!/ES1! Day Trade Plan for 03/18/2025MES!/ES1! Day Trade Plan for 03/18/2025
📈5740. 5760
📉5680. 5660
Like and share for more daily ES levels 🤓📈📉🎯💰
*These levels are derived from comprehensive backtesting and research and a quantitative system demonstrating high accuracy. This statistical foundation suggests that price movements are likely to exceed initial estimates.*
S&P 500 E-mini Futures VWAP Breakout Strategy Sharing a solid intraday idea for you all – something I’ve been running on the S&P 500 E-mini Futures (30-min chart) lately, and it’s been delivering clean setups.
VWAP Breakout Play
I’m focusing on simple VWAP-based breakouts. Here’s the breakdown:
The setup:
• Wait for price to break above or below the VWAP with strong momentum (big candles + solid volume).
• I always confirm with a momentum indicator like MACD or RSI to filter out the noise.
Entries:
• Breakout Long: When price pushes above VWAP + momentum aligns.
• Breakout Short: When price dumps below VWAP + momentum confirmation.
Exits & Stops:
• Scale out at session highs/lows or key pivots.
• Stop-loss goes just beyond VWAP to keep the risk tight.
• If momentum fades, I’m out.
Why I like it:
VWAP attracts institutional flow, and combining it with momentum gives this strategy a solid edge, especially around U.S. session opens when volatility kicks in.
Give it a try and tweak it to your liking!
S&P500: Bottom is in. Strong 5month rally ahead.S&P500 is bearish on its 1D technical outlook (RSI = 38.840, MACD = -92.170, ADX = 55.129) as it hasn't crossed above the 4H MA50 or the 1D MA50 yet. Still, it did price the bottom on the HL trendline of its 2year Channel Up. The 4H MACD formed however a new Bullish Cross on the LH trendline, same as the October 31st 2023 HL bottom. As the market did then (October 2023), the 4H Death Cross that took place last week, happened exactly at the bottom and the 0.618 Fibonacci of the previous HL. We are still bullish and our target remains the -0.618 Fib (TP = 6,900).
## If you like our free content follow our profile to get more daily ideas. ##
## Comments and likes are greatly appreciated. ##
ES futures update 18/03/'25In today's market update, I maintain a neutral stance. While we saw a breakout yesterday, price has since been rejected at the 1-hour resistance. The key area I'm watching is the 4-hour demand zone.
Since the overall trend on higher timeframes remains bearish, I plan to wait until price reaches this level—I'm cautious about entering long positions. If price clearly rejects bullishly from the 4-hour demand zone, I will go long.
However, if the 4-hour demand zone breaks down, I'll look for a short position on a retest of this zone.
ES Morning Update March 18thYesterday, the plan for ES was straightforward: rally to ~5755 (adjusted for the June contract, previously 5703 on March) to back-test the 3-month megaphone breakdown from last Monday. The market followed through with an 88-point rally to that level before selling off.
As of now:
• 5720 (reclaimed) and 5698 are key supports
• Holding above keeps 5739 and a second test of 5754 in play
• If 5698 fails, look for selling pressure toward 5668
S&P500 Channel Down broken. Will the 4H MA50 sustain an uptrend?The S&P500 index (SPX) broke above both its 1-month Channel Down and 4H MA50 (blue trend-line) yesterday and more importantly is so far keeping the price action sideways above it.
This is an indication that it may flip it from previously a Resistance, into Support. The signal for this bullish trend reversal came first (and a very timely one) by the 4H RSI, which formed Higher Lows against the price's Lower Lows on March 13, a clear Bullish Divergence. That turned out to be the bottom.
Now that bullish break-out has been confirmed, we expect a quick test of the 4H MA200 (orange trend-line) on the 0.618 Fibonacci retracement level. Our short-term Target is 5900.
-------------------------------------------------------------------------------
** Please LIKE 👍, FOLLOW ✅, SHARE 🙌 and COMMENT ✍ if you enjoy this idea! Also share your ideas and charts in the comments section below! This is best way to keep it relevant, support us, keep the content here free and allow the idea to reach as many people as possible. **
-------------------------------------------------------------------------------
Disclosure: I am part of Trade Nation's Influencer program and receive a monthly fee for using their TradingView charts in my analysis.
💸💸💸💸💸💸
👇 👇 👇 👇 👇 👇
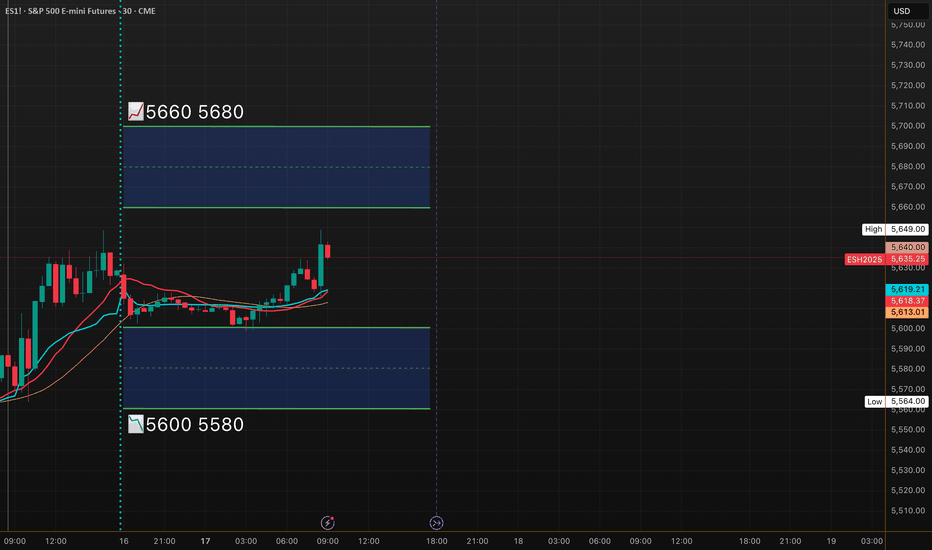
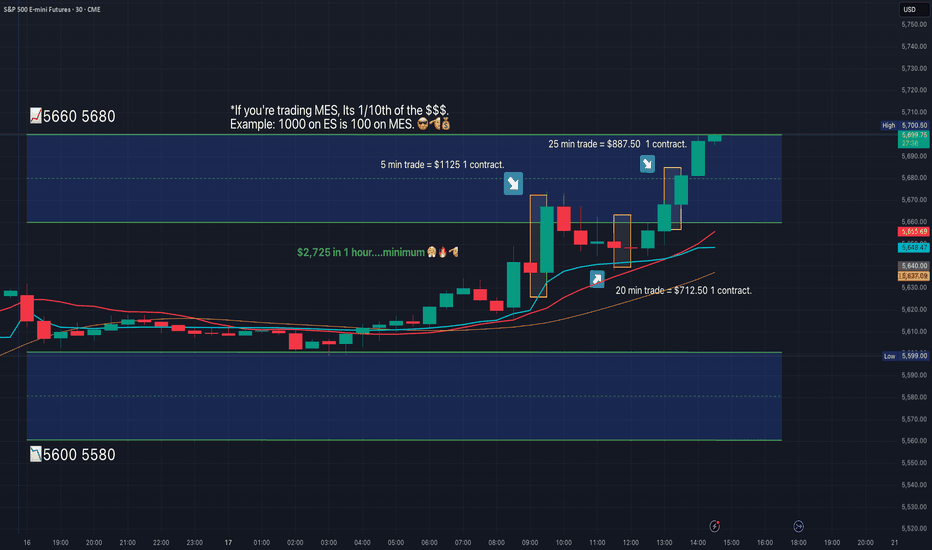
MES!/ES1! Day Trade Plan for 03/17/2025MES!/ES1! Day Trade Plan for 03/17/2025
📈5660. 5680
📉5600. 5580
Like and share for more daily ES levels 🤓📈📉🎯💰
*These levels are derived from comprehensive backtesting and research and a quantitative system demonstrating high accuracy. This statistical foundation suggests that price movements are likely to exceed initial estimates.*
S&P500 First bullish break out after a monthS&P500 crossed today above both the 1 month Channel Down and the MA200 (1h).
The latter was intact since February 21st.
The MA100 (1h) has the potential to turn now into the short term Support.
Trading Plan:
1. Buy on the current market price.
Targets:
1. 5900 (the 0.618 Fibonacci retracement level).
Tips:
1. The market just formed a MA50/100 (1h) Bullish Cross. The first since Feb 13th.
Please like, follow and comment!!
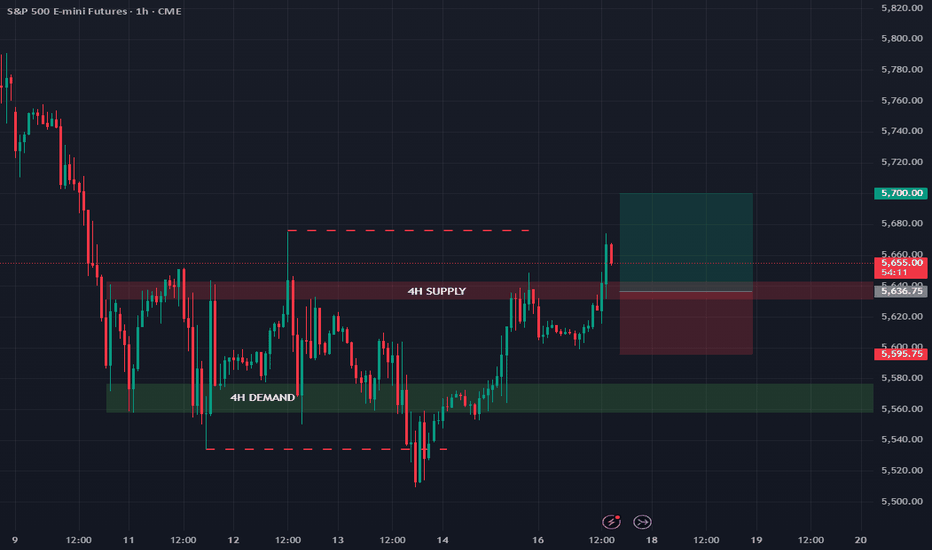
ES futures update 17/03/'25Last week, I mapped out some trading zones that are still valid and unchanged.
The 4H supply zone has broken out, so I will be looking for a long position after a retest of this broken supply zone, which should now act as support.
My last trade was a short from this zone, resulting in a small profit since market closing prevented reaching the full take-profit target.
Let's see if the bullish momentum can hold during the retest entry.
As always, follow for more market updates.
ES Morning Update March 17thOn Thursday, ES reclaimed 5558, triggering a long setup that led to a rare green day. The 5645 target was hit on Friday after a strong trend day. With that momentum, today is likely to be more complex—hold runners.
As of now:
• 5599, 5615 are key supports
• Tests of 5599 and recoveries of 5615 are actionable setups
• Holding above keeps 5644, 5666+ in play
• If 5599 fails, expect selling pressure to increase
MES!/ES1! Day Trade Plan for 03/14/2025MES!/ES1! Day Trade Plan for 03/14/2025
📈5600 5640
📉5560 5520
Like and share for more daily ES levels 🤓📈📉🎯💰
*These levels are derived from comprehensive backtesting and research and a quantitative system demonstrating high accuracy. This statistical foundation suggests that price movements are likely to exceed initial estimates.*
ES Morning Update March 14thYesterday was all about 5558 in ES. After a drop to 5512 support, bulls needed to reclaim 5558 for upside. That level was tested twice before a sell-off, but once it cleared at 8:30 PM, buyers stepped in, pushing the market +20 points higher.
As of now:
• 5598, 5615 are the next upside levels as long as 5558 (now weaker) holds
• A break below 5558 opens the door for a drop to 5548, then 5533
S&P500 Index Goes 'DRILL BABY DRILL' Mode due to Tariffs BazookaThe Trump administration's aggressive use of tariffs — we termed at @PandorraResearch Team a "Tariff' Bazooka" approach due to their broad, unilateral application — has exerted significant downward pressure on the S&P 500 index through multiple channels. These include direct impacts on corporate profitability, heightened trade war risks, increased economic uncertainty, and deteriorating market sentiment.
Direct Impact on Corporate Earnings
Tariffs raise costs for U.S. firms reliant on imported inputs, forcing them to either absorb reduced profit margins or pass costs to consumers. For example, intermediate goods like steel and aluminum—key inputs for manufacturing—face steep tariffs, squeezing industries from automakers to construction. Goldman Sachs estimates every 5-percentage-point increase in U.S. tariffs reduces S&P 500 earnings per share (EPS) by 1–2%. The 2025 tariffs targeting Canada, Mexico, and China could lower EPS forecasts by 2–3%, directly eroding equity valuations6. Additionally, retaliatory tariffs from trading partners (e.g., EU levies on bourbon and motorcycles) compound losses by shrinking export markets.
Trade Escalation and Retaliation
The EU’s threat to deploy its Anti-Coercion Instrument—a retaliatory tool designed to counter trade discrimination—could trigger a cycle of tit-for-tat measures. For instance, Canada and Mexico supply over 60% of U.S. steel and aluminum imports, and tariffs on these goods disrupt North American supply chains. Retaliation risks are particularly acute for S&P 500 companies with global exposure: 28% of S&P 500 revenues come from international markets, and prolonged trade wars could depress foreign sales.
Economic Uncertainty and Market Volatility
The U.S. Economic Policy Uncertainty Index (FED website link added for learning purposes) surged to 740 points early in March 2025, nearing levels last seen during the 2020 pandemic. Historically, such spikes correlate with a 3% contraction in the S&P 500’s forward price-to-earnings ratio as investors demand higher risk premiums. Trump’s inconsistent tariff implementation—delaying Mexican tariffs after negotiations but accelerating others—has exacerbated instability. Markets reacted sharply: the S&P 500 fell 3.1% in one week following tariff announcements, erasing all post-election gains.
Recession Fears and Sector-Specific Pressures
Tariffs have amplified concerns about a U.S. recession. By raising consumer prices and disrupting supply chains, they risk slowing economic growth—a fear reflected in the S&P 500’s 5% decline in fair value estimates under current tariff policies. Industries like technology (dependent on Chinese components) and agriculture (targeted by retaliatory tariffs) face acute pressure. For example, China’s tariffs on soybeans and pork disproportionately hurt rural economies, indirectly dragging down broader market sentiment.
Long-Term Structural Risks
Studies show tariffs fail to achieve their stated goals. MIT research found Trump’s 2018 steel tariffs did not revive U.S. steel employment but caused job losses in downstream sectors8. Similarly, the 2025 tariffs risk accelerating economic decoupling, as firms diversify supply chains away from the U.S. to avoid tariff risks. This structural shift could permanently reduce the competitiveness of S&P 500 multinationals.
Conclusion
In summary, Trump’s tariff strategy has destabilized equity markets by undermining corporate profits, provoking retaliation, and fueling macroeconomic uncertainty.
Overall we still at @PandorraResearch Team are Bearishly calling on further S&P 500 Index opportunities with further possible cascading consequences.
The S&P 500’s recent slump reflects investor recognition that tariffs act as a tax on growth—one with cascading consequences for both domestic industries and global trade dynamics.
--
Best 'Drill Baby, Drill' wishes,
@PandorraResearch Team 😎
S&P500: Bottom of 2 year Channel. Target 6900.S&P500 is oversold on its 1D technical outlook (RSI = 27.644, MACD = -113.480, ADX = 60.232) as the price didn't only cross under the 1D MA200 but is also almost at the bottom of the 2 year Channel Up. In the meantime, the price reached the 0.618 Fibonacci retracement level while the 1D MACD touched its LH trendline. The last time all those conditions were met at the same time was on the October 30th 2023 Low. What followed was a massive rally to the -0.618 Fib extension before the next 1D MA50 pullback. This is a unique opportunity to buy and aim for the -0.618 Fib (TP = 6,900).
## If you like our free content follow our profile to get more daily ideas. ##
## Comments and likes are greatly appreciated. ##
ES Morning Update march 13thThis week has revolved around one key level in ES: 5568-72, which has been lost and reclaimed four times. At 11:20 PM yesterday, it triggered a long setup from an a textbook failed breakdown, leading to a 65+ point rally—and overnight, the same pattern repeated again.
As of now:
• No change—5568-72 remains weak support
• A 5599 reclaim sets up a move to 5616, 5643+
• If 5568 fails, expect further downside
ES Morning Update March 12thSince I prioritize Failed Breakdowns, my job is pretty simple—do absolutely nothing until we get one. This is how you keep an incredibly high wind rate, while easily scaling your accounts. Yesterday, the 5569-72 reclaim triggered the long setup, leading to a 70+ point rally to the 5608 target, where we’re still holding.
As of now:
• 5599, 5569-72 must hold through CPI volatility to keep 5645, 5668, and 5703 in play
• A failure below could open up more downside
S&P500 Strong Support cluster on the 2-year Channel Up.S&P500 (SPX) has been trading within a 2-year Channel Up that has made the market recover from the 2022 Inflation Crisis, taking it to a new All Time High (ATH).
The recent 4-week decline however has been an aggressive one and rightly so has sparked heightened fear to investors, especially considering the trade war fundamentals. Technically, the index just broke below its 1W MA50 (blue trend-line) and is approaching the bottom of this long-term Channel Up, a development that in the eyes of short-term traders is disastrous.
On the long-term though, this is a very strong Support level as the market seems to be repeating the Secondary Channel Up (blue) of February - October 2023. The end of this was also an aggressive correction which broke below both the 1W MA50 and 0.382 Fibonacci retracement level temporarily before starting a massive Bullish Leg. Even the 1W RSI sequences among the two fractals are similar, despite the current price action being more aggressive.
Interestingly enough, they both declined by at least -10%, so if we see the current week closing in green and by the next starting to recover, it is likely to see a similar Bullish Leg to test the -0.5 Fibonacci extension as the April 01 2024 Top did. That would give us a 6900 long-term Target, which would be a +24.75% rise from the current low, exactly identical with the rise from the April 19 2024 to February 19 2025.
-------------------------------------------------------------------------------
** Please LIKE 👍, FOLLOW ✅, SHARE 🙌 and COMMENT ✍ if you enjoy this idea! Also share your ideas and charts in the comments section below! This is best way to keep it relevant, support us, keep the content here free and allow the idea to reach as many people as possible. **
-------------------------------------------------------------------------------
Disclosure: I am part of Trade Nation's Influencer program and receive a monthly fee for using their TradingView charts in my analysis.
💸💸💸💸💸💸
👇 👇 👇 👇 👇 👇
S&P500 Channel Down good until cancelled.S&P500 / US500 is trading inside a 20day Channel Down that spearheaded the technical correction from last month's All Time High.
The 1hour RSI is on a bullish divergence and within this pattern this has signalled a temporary rebound near the 1hour MA100 for a Lower High rejection.
As long as the pattern holds, a tight SL sell position there is the most optimal trade, aiming at 5450.
A crossing over the 1hour MA200, invalidates the bearish sentiment and restores the buying bias. In that case, take the loss on the sell and buy, aiming at 6040 (Fibonacci 2.0 extension).
Follow us, like the idea and leave a comment below!!


