Es_f

$ES_F / $SPY: Supply & Demand Zones for 06/09/21Plan for Wednesday, June 9th, 2021:
Long: Between $4,221.50 - $4,205.75
Long Cut Loss: Break below $4,205.75
Short: Between $4,233.50 - $4,236.75
Short Cut Loss: Break above: $4,236.75

S&P 500 on its way to new ATHFor continued positive momentum, should hold 4208 overnight or at most 4190. Close below 4180 could mean deeper pullback till trend line support. Overhead trend line is possible resistance on its way to 4300 (target/resistance) there.

potential bearish crab on $spyJust a crab... not a blind short call, still been wary of a correction to come soon, as long as these recent highs not taken meaningfully the potential for a dive (and likely a fast one is here).

S&P 500 bulls under pressure Just like Nasdaq, bulls of S&P 500 are also under pressure. It rejected 4185 first and then unable to close above 4169 level. Now must hold 4129 level. Close below 4113 red flag. Trend line last line for bulls to defend. Then upside target still 4221. This week may decide direction for S&P 500. A cautious bullish bias.

S&P futures getting closer to upside resistance level. Upside target is still 4235 as long as 4113 holds. If 4163 fails, next bullish bounce can be seen from 4146 or 4135. Close below 4113 may indicate short term trend change unless we see a quick crash and bounce around 4050. On upside, 4188 is immediate resistance, once overcome can move towards 4235-4240.

ES going to test 4230 first.ES has been showing strong bullish trend so far. No signs of bears taking over yet. Can it happen? Sure. First level it can happen is around 4230 and next 4315. If it looses 4113 support, next levels as marked.

S&P Futures Top on 5 Month Trendline?ES is down 2 days in a row (what!?). I'm 'looking' lower. The first big level to know on the downside is 3959/79. This zone is defined by highs from February and March along with the 50 day average. For more analysis and ideas, visit scandinavianmarkets.com .

#ES_F update to trend rays... top soon?Almost a month from the bottom identification. We're in thin air...

Weekly Analysis for #SPX for 12-16 April 2021Trend: Daily/Weekly/Monthly: Up/Up/Up
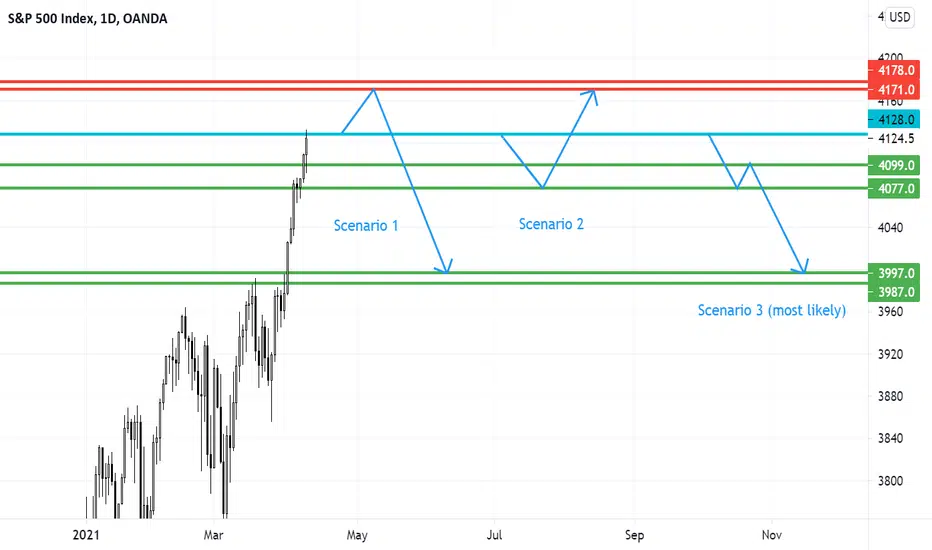
#SPX at ATH; nobody can call a top, but YET, my most probable scenario is a drop - just for fun. What will be the trigger? I don't know. I need a sell from Globex open for it to happen.
3 scenarios:
1) Globex open, Powell's speech cause the rally to 4171-77 before a sell off in US session to end the day and we move down lower rest of week, to 3987-97.
2) Globex open and sell, we find support at 4077-99, before ending the week higher at 4171-77.
3) Globex open, gap up to some new highs 4135, but sold off, Powell's speech, cause further selling, we range mid of week, before ending at 3987-97.
3) is my most probable scenario to kill everyone.


#ES_F Crucial LevelsVery simple...
Confirmation below the bottom ray is death.
Confirmation above the top ray = send-mode: engaged.
We're stuck in this range for now... my bias is leaning toward the upward move.
-GD loves you <3


23 March 2021 - ES LevelsOrderflow pivot from yesterday RTH @ 3929.25. We pivoted short in the evening and rotated through some low volume areas from earlier in Monday's RTH. Continued downside pressure could see us repair the lows around 3902. Current short targets would be 913-11, 903-901, 888-885. Upside above the pivot, looking for 48-50, 59, 70.


ES: Short the double topThere is a low risk short here after ES forms a double top. It should head lower from here

Weekly Analysis for #SPX for 15-19 March 2021Trend: Daily/Weekly/Monthly: Up/Up/Up
Super bullish week for indices except NDX. Continuation for the coming week is expected, isn’t it? However, we have important resistance just above.
3 possible scenarios:
1) As long as 3951-61.9 resistance zone holds, look for shorts targeting 3841-71 support zone. This zone should hold for a next leg up, to 4033.
2) We have a fast rally from open to 4033-61 resistance zone, by Tuesday or Wednesday, where we see a sharp rejection for a strong move down to 3871.
3) SOMEHOW (I can’t see any trigger except NDX weakness), we open in Globex and sell off start, target 3791 before a bounce to 3841-71 and further selling to 3739
IMO, scenario 1 is most likely.


