ES: Ripe for a pullbackES has ramped higher since the March lows but we are currently hitting an inflection point. We have closed the initial gap from the decline earlier this year and there is negative divergence on the daily RSI. This is a good R/R short.
Es_f

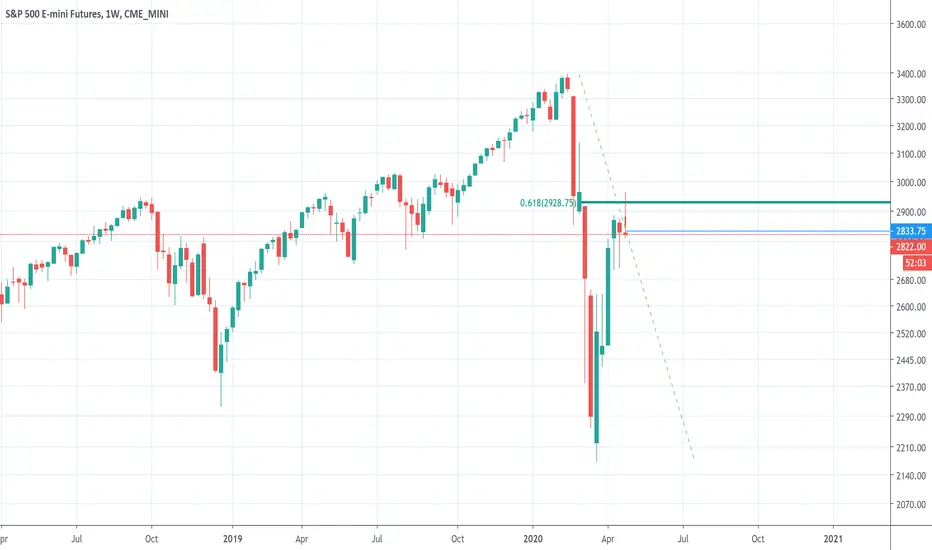
Trend Remains Up in the S&P500Hard to be bearish the S&P500. After a false breakout in Feb above the 261.8 Fib ext from the 07-08 high/low, price just reclaimed the breakout level with a big green monthly candle, closing w/ the highest monthly close ever. The trend remains up and to the right. $SPY $ES_F $SPX

S&P 500 E-Mini Futures (ES_F) Correction in progressElliott Wave View in S&P 500 E-mini Futures (ES_F) suggests the rally from 6.15.2020 low has ended at 3226.25 high as wave (1). Up from 6.15.2020 low, wave 1 ended at 3156.25 high and wave 2 dips ended at 2982.72 low. Index then extended higher in wave 3 towards 3184 high. The internal subdivision of wave 3 unfolded as 5 waves impulse Elliott Wave Structure. Wave ((i)) of 3 ended at 3021 high and wave ((ii)) pullback ended at 2988.50 low. Rally higher in wave ((iii)) then ended at 3156.50 high, followed by wave ((iv)) pullback which ended at 3105.75. Wave ((v)) then extended higher and ended at 3184 high.
Wave 4 pullback then unfolded as a zig-zag Elliott Wave structure and ended at 3105.25 low. Finally, wave 5 higher ended at 3226.25 high. This final move completed wave (1) in higher degree and ended cycle from 6.15.2020 low. Index is currently correcting that cycle within wave (2). The correction is unfolding as a zigzag structure where wave A ended at 3190 low. Currently, wave B remains in progress and will be followed by another leg lower in wave C. While pullback stays above 2982.72 low, expect the dips in 3,7 or 11 swings to find support for more upside.

Futures headed towards 290'sA. After the huge dip recovery we see $ES_F, holding 200MA on each dip.
B. We see the MA's converging and $ES_F honouring the wedge real nice.
C. Markets trending sidelines and no real strength left.
D. Banking flushed after the news yesterday (fed-puts-restrictions-on-bank-dividends-after-test-finds-some-banks-could-be-stressed-in-pandemic)
E. Major segments taking an hit , one after the other.
F. Tech's holding the bullish trend.
What can we expect?
a. Break of 200MA and downtrend towards 61.8 (2939)
b. Consolidation at 290's levels.
c. Reclaim of 200MA before we see more flush.


Nasty fall after failed breakout of 3150s, next stop 3030 and 3kshort side getting a party up in here.
cases in texas and florida skyrocketing.

Hard resistance in 3150, fail or overcome?3150 is an important level that opens up opportunity for 3200+, but being a friday plus the famous quad witching, things could go sideways

New highs more likely in S&P than new lowsS&P continues to trend in this upward slope, w/ varying degrees of volatility. I don't use this band to suggest the lower bound is solid support or the upper bound is resistance, only to help identify the trend and the range. New highs more likely than new lows imo $SPY $ES_F

$SPX Highest Probability Elliott Wave Projection LTMedium-Long Term. Notes on chart. Please hit that like buttom! Thanks


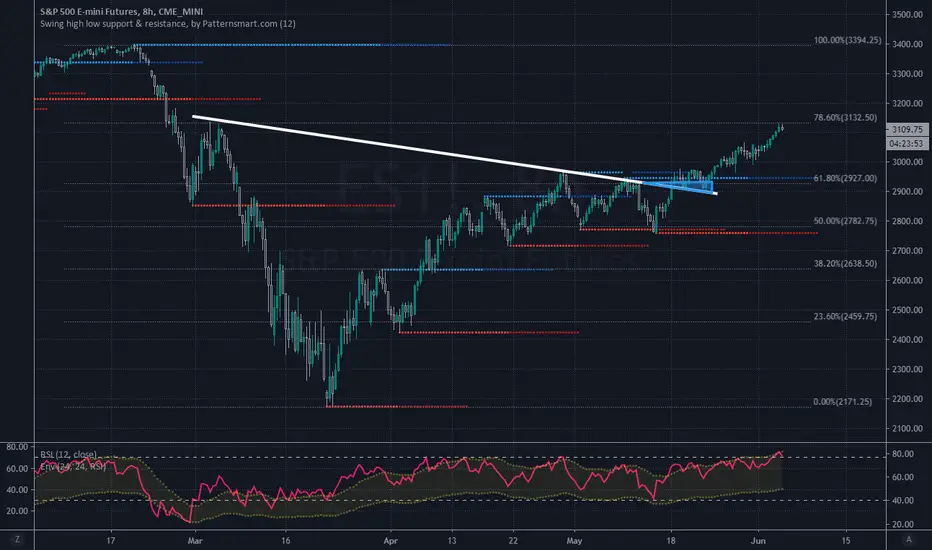
A Strong Candidate for the Turn$ES_F: the 78.6% Fibo has been gently caressed, the RSI is turning down from overbought levels, so yes - the turn could finally be upon us!
Broke out of wedgeJust passed over 200 ma and continuing to rise. Let's see how far we go. 3090 would be my next level.

Taylor Technique ... Raschke/Connors 80/20 ES_F YM_FA little something to put in your toolbag...
The fade this morning falls in line with the Taylor Technique for swimg trade fades of previous days highs/lows when the previous day opens in its lower/higher 10% and closes in its higher/lower 90%.
When this occurs the retest of the previous day hi/lo is likely and IF they fail to hold a fade is likely.
Raschke & Connor modified it to 80 & 20% i believe to create more trading ops. Google it.
I track these levels on a daily basis with a fib tool marked at 80/20 (yellow lines)
Yesterday the ES & YM both opened in their respective lower 20% and closed in their respective 80% The RED line is the previous day high.
Note the YM tested and faded while the ES was unable to retest setting up the bearish reversal resulting in an intial 250+ pt ym and 30+ pt es move.
I trade the ym but watch the es for signals. These may have occurred on the nq & rty as well but I dont track them.

Ascending channel DJIA YM approaching previous post COVID19 topsPrica action riding ascending channel into previous tops. Possible test of and fade of any of these 3 highs (yellow lines)

ES: We're stopping hereES is running into multiple resistance. Measured move could take it to 2990 but that would be a great short for a trip to new lows.

ES: The ice is starting to crackToday we reached an important target in ES. We have reached proportionality in the A=C corrective waves where we have completed an ABC. ES has also run into trendline resistance and is now beginning to look very fragile. I would short it here looking for a retest of the lows.

S&P500 Futures ES_F - Flipped the breakerES_F defying all odds even in the face of enormous p/e and peg valuations. I find it a bit concerning that the market is pricing in pretty much zero expectations of growth loss for the major S&P 500 companies and I fully am watching for a rug pull if fundamentals ever catch-up with reality. Headwinds of decreased productivity from social distancing, decreased globalization, decreased GDP and consumer spending, increased cost, potential increase corporate taxes to fund deficit, will cause ripple effects not seen in the market.
Regardless, as a price action trader all i see is bullishness. Shorts are being squeezed and FOMO is happening. From a price action stand point, we bounced strong from the bullish OB after tapping the .618 range. I previously shorted the bearish breaker and we’ve broken past it and turned it into support. Expect an easy test of recent highs and likely a push past to squeeze out liquidity. I’ll be watching above $3k for any reversal signs and if we start to get to a cycle market top. Keep an eye out on the daily 200MA.
Long for now. Matches the thesis I’ve published regarding NQ also pushing to fill the gap.

ES SPY Short term entries and targetsI avoid shorting ES, but if it becomes this obvious I won't be able to control myself.

Sell in May and go awayS&P hit the 61.8% retracement of the decline and then immediately proceeded to give back all its gains of the week, producing a very bearish looking weekly candle. Sell ES. I am expecting a retest of the lows into the summer.
ES: Cycles argue for a downturn next weekLooking at the cycle from the high to the primary low in February, we can see that if we extend the cycle turns they do a pretty good job at picking inflection points. Furthermore if we take the timespan from the high in January to the low on 23rd March (depicted in orange cycles on top) we can see that the length of time for the impulse lower is almost exactly equal to the length of time of this correction higher from the March 23rd lows. Very good symmetry arguing that we have seen the interim high and that ES should be heading lower into the next cycle turn in Mid May.

ES: It's time to wake up (short)The S&P has gone on a face ripping rally since the lows in late March. This has led a lot of investors to become complacent with the mistaken belief that the Fed will save them. They are gravely mistaken and next week should kick off some vicious selling. My target is 2300.

Starting to form the turnThought today we were breaking the turn around pattern by moving up early in the day. Well that got changed around when the announcement of the failed GILD treatment came out. We are still holding the pattern as of now. It looks like we could see 2714-15 first, then 2640 to hit that 38% fib retracement. Wondering if we will bounce around that area for a while until something comes out to redirect us. 🤔

SPY This Duck is looking less and less like a DuckFollow up to my post over the weekend.
Further support that the ABC corrective wave has become a 5 Wave Impulse. Approx target 3110-3130
(I'm just looking the Elliott rules up online as I go, so if I'm misinterpreting them feel free to call me a jackass)
