Looking at taking below 2722.25 short based on 30min candleCurrently testing the near term uptrend with an indecision candle on the daily again. We failed to break above 38 on three attempts. The market was muted to slightly down with JPow's speech in D.C. 2722 area is solid support and I like the buying that came in just above there. However if price can't clear 2726 and stay above 2728, most likely will continue down breaking the uptrend line.
Let's see what she does. As always let price discovery be your guide :-)!
Es_f

Will ES test its daily 200 day sma this week?We are testing 2712.25, which is a strong pivot (Resistance) on the daily. Nice little doji forming on Friday. I'm looking for a continuation up to test the 200 day sma around 2745 with as high as 2760s before a bigger pullback as long as 2716 is taken out with strength.
Of course if we lose the low of Friday and ultimately 2690, we could test lower off the trendline.
As always let price discovery be your guide :-).

ES!1, Primed for a directional moveA very balanced day with a narrow range. A doji daily candle. The market took a pause to build a mature balance. Usually, this type of a price action leads to a directional move in the following day. Watch for a conviction, a strong bar originated from the high value node around 2633-37. That conviction with a good volume should take the price above 2677 or below 2596. Recently, the correlation between the indices was high. They move in sync. However, if one of them shows its hand first that could be a first sign. Some observation: The bonds continue to rise, the institutions buy safe assets. The dollar was trending higher today. These two factors are not supporting the rise of the equities.
01/24/2019

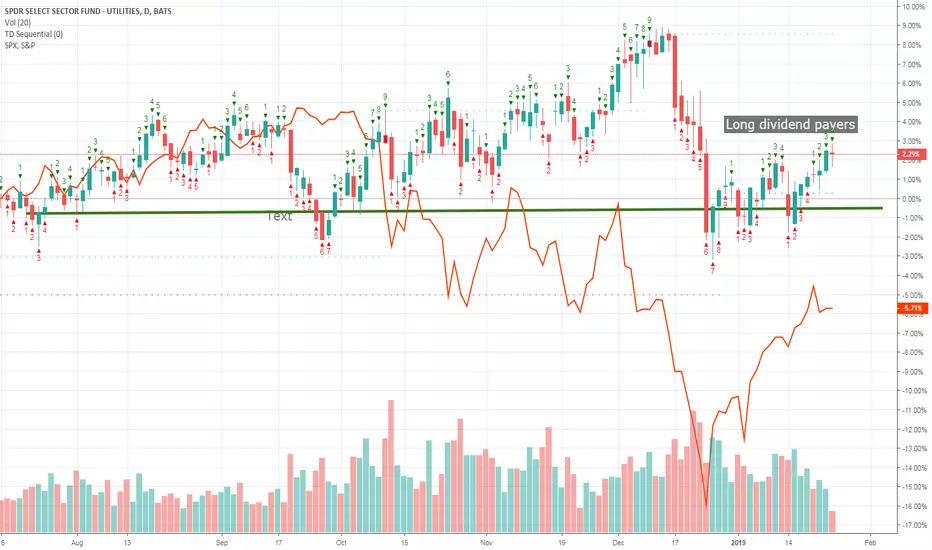
Utilities are back in playDividend payers within the Utilities sector are outperforming the S&P after its fall from grace
due to the PG&E bankruptcy.

ES1!, The market is testing everyone patienceThe RTH daily range is contracting. The price did not get neither to OVN low or high. No changes to the market structure. There is a composite high value node at 2584 . Usually, a high value node is a launching point of a directional move . Something to watch. At this point the buyers continue to dominate. There is no obvious signs of their failure. This week we may see some resolution sparked by banks earnings. Once observation for today: the buyers are running out of steam - there were not able to close the gap left from OVN session.

TVIX Lotto setup. Not yet,but soon.The TVIX Lotto is getting setup. Not yet,but soon... by the 18th, I think.
Will long soon ....

ES1!, where we go from here...Here is an updated chart. The daily range was contracting day after day and this is typically a sign of a bigger move coming soon. It does not really matter what will spark it. Let’s start from the upside scenario and what is in favor of it. A small consolidation area is formed at the upper edge of the balance. A breakout of that small area will be a breakout of the larger balance as well, market is fractal. The price has a tendency to extend a mature balance 100% . The empty rectangle above is the projected area for the price to move and fill it. What else is in favor of the upside scenario - a notable resilience. The buyers clearly in control and buy even shallow pullbacks. Now, the downside scenario. A breakdown of the small upper balance and the trendline with a strong initiative move will lead to a retest of 2546 area first. Watch how the small consolidation area in the middle will be sliced through like it does not exist. Those are trapped buyers that will be covering their positions. The potential target is bottom edge of the balance 2520. That level could provide a nice bounce on first test. If you are an active trader that would be your cue to go long and play the bounce. After that I anticipate a consolidation at the lower edge.
Have a great weekend!

ES, latest updateThe updated chart with minor and major levels to watch applicable for day trading. The price continues to be resilient and the buyers maintain the control. The channel was broken OVN and that encouraged the sellers at the RTH opening. However, the sellers failed to take out 2561 level and the buyers stepped in ahead of the OVN low. The shorts got squeezed again and that set the day’s bias. The broken channel bottom was tested twice and provided a tradeable reaction. The market is looking for a catalyst to break the recent balance. The dovish Feds news is getting old. One thing was interesting to observe how the algos reacted during Feds chair conference. It was amazing to watch the price action. The minute he said about continuing to unload their balance sheet - a strong downside move. The price normal flow gets interrupted by such remarks. Nevertheless, the bulls reclaimed their positions after that. At this point the market is building energy at the upper edge of the recent balance. That fact is increasing odds for the upside breakout. Today’s low is important level for the bulls and losing it may shift a short term bias to the sell side.

HISTORY REPEATS ITSELF: SHORT BMYBMY is showing erie similarities of its last major cycle, and it appears massive downside is on the horizon. Decreasing RSI, strong support and resistance and the exact same chart pattern are more than enough to show BMY is likely headed down at least 20% over the next few months.
Sizable downside in the overall market over the next few months will likely add to the selling pressure. Price target is $32 by Q4 2019.


Nasdaq Futures Trading Plan for 20181112Crossing up GREEN with notable volume = LONG
Bouncing off RED (failed breakout to the upside) = SHORT
Crossing down RED with notable volume = SHORT
Bouncing off RED (failed breakout to the downside) = LONG


ES_F low risk short again#ES_F testing previous lows.. the pullback rise has been too steep here is a short opportunity near 2710-15 with Stops above 2740. retest the levels of 2680 and lower again


My new indicator UP closes in the last 40 days ...My new indicator UP closes in the last 40 days ...

#ES breakdown of the swing trend line on the cardsES has been oscillating within the range, a close below the trendline will lead to a potenatial downside move


ES_F Pullback trade opportunity#ES_F has a low risk pullback trade opportunity here. 2745-50 are long term resistances and also upper extensions of long term composites. this has a likelihood to test 2720- 2705 on the downside.

/ES - Overnight SwingSimilar to my SPY analysis - i was a bit shocked on Friday and did lose on my puts at the 61.8% retracement level. I am planning to scalp this overnight and will sell after /ES reaches 24% fib retracement (2771-ish range)
If it rejects off the 24% fib, I am planning to long PUTS, predicting another impulse wave down. This wave down may break /ES outside of the consolidation triangle.
Marking this neutral since it is a short scalp. I will update the chart tomorrow morning.

Bearish /ES CountThis is a possible bearish count, with the A wave going in so fast its likely the B wave is complex, we may see a C wave which will be a 5 wave structure down to finish this Wave 4 correction. Keep in mind this correction hasn't lasted very long, but anything is possible from here
