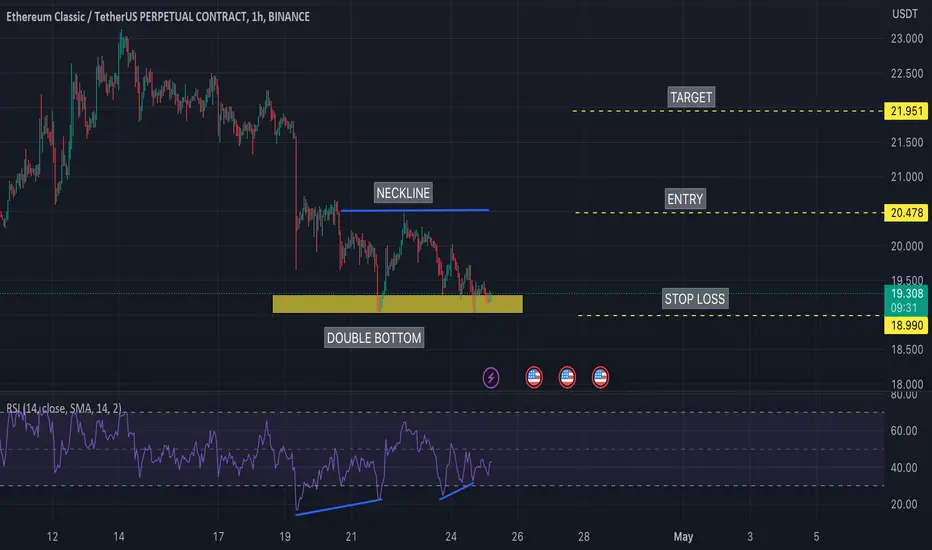
W9.1-27 ETC BULLISH IDEA (DOUBLE BOTTOM)Potential Bullish Entry
Dow Theory In Place - Higher High and Higher Low Expected in Place Formation of DOUBLE bottom coupled with bullish divergence (Bullish reversal pattern) SL & TP Levels are defined.
Etc
ETC/USDT Technical Analysis: Potential Breakout on the HorizonETC/USDT Technical Analysis: Potential Breakout on the Horizon
Ethereum Classic (ETC) is currently trading at $19.60 against the US Dollar Tether (USDT) on the 1-hour chart. Technical analysis suggests that a potential breakout may be on the horizon, with the next target being $21.14, a 7% increase from the breakout level.
LTF (1H) Chart Analysis:
Looking at the 1-hour chart, ETC is hovering near its breakout level, which could lead to a bullish move if broken. If the breakout occurs, the next target will be $21.14. However, if ETC is rejected from this level, we could see a drop in price back down to the HKEX:18 - HKEX:19 range.
Resistance and Support Levels:
The current resistance level is at $19.75, while the support level is at $19. This means that if the breakout occurs and the price goes above the resistance level, we can expect bullish momentum. On the other hand, if the support level is broken, we may see a bearish trend.
Takeaways:
ETC is currently trading at $19.60 against USDT.
The 1-hour chart suggests a potential breakout on the horizon.
If the breakout happens, the next target will be $21.14.
A rejection from this level could lead to a drop back down to HKEX:18 -$19.
The resistance level is currently at $19.75, while the support level is at $19.
Conclusion:
Based on the technical analysis of the ETC/USDT pair, a potential breakout may be on the horizon, with a next target of $21.14. However, it's important to keep an eye on the resistance and support levels to gauge potential market movements. If the support level is broken, we could see a bearish trend, while a breakout above the resistance level could indicate bullish momentum. As always, traders should conduct their own research and exercise caution when making trading decisions.

✴️Ethereum Classic Will Also Recover (222% Possible Higher high)Volume is one of the strongest indicator and can help you clear any doubts.
Ethereum Classic (ETCUSD) hit a higher low compared to June (5 months ago) but how to know if it will recover here or continue lower?
Here we use the volume indicator.
Notice how trading volume continues to diminish, it goes lower and lower.
That's your signal.
It means the current trend is losing strength.
Since the mid-term trend is bearish, as it loses strength things can turn and ETCUSD reverse.
Higher lows can lead to higher highs.
Over 222% possible on a higher high.
Easy 50% to 80%+ on a bounce.
You still need a plan to trade and your own research.
The support levels are marked with blue on the chart and can be used as a stop-loss.
These analyzes are not intended as financial advice.
Thank you for reading.
Remember to boost 🚀
Namaste.

building a base to 1350 from abcd pattern looking for flag to looking at eth, I see a base building and a abcd pattern. Im looking for a 1350 retest and a bull flag breakout set up to retest 1650.. I dont believe it goes higher. After the recent short im a buyer of the dips

etcIt has a short-term resistance range that can help to open long trades on the green lines and see higher targets in case of failure.

ETHBTC bullish move, potential 114% up trendwww.tradingview.com
Just check the consolidation in the BTC pair and the potential up-trend.

Would you Buy this? The idea here is simple, Long people.Going to start to scale in here. I was self educating back in 2018, about sept. Needless to say as a new trader i thought I could just scalp up and make
a fortune, LOL, after my 4th year now I know what to do!!! Just buy it and leave it alone. Thats it and that's all. If you are new and reading this please save yourself
a few years of tuition and buy it and walk away, that's it seriously!!!

✴️ Ethereum Classic Long Consolidation, The Bright SideIt's been a while since my last update since the conditions remain the same... Earlier this year I was sharing updates basically daily since we did great with this Altcoin back in mid 2022.
I will go through the whole thing because many people are new.
We compared the consolidation phase from July 2022 above EMA100 (blue line on the chart) and how this led to a strong bullish wave.
ETCUSDT is now back above EMA100 but instead of 2 weeks, its been months hovering around this level.
The bright side of this, the good news.
The fact that Ethereum Classic has been consolidating forever around this level before moving forward, establishes a strong support.
This might be the last time we see this Altcoin at HKEX:20 something... Once it moves up, it will go strong and it might never come back down.
If it does move back, then this would be the bottom/higher low, near the current price.
The longer the consolidation phase in duration, the stronger the bullish breakout when it comes.
It will be massive... And prices will move much higher than anything you can expect and the growth we will experience will be for the long-term.
Remember, this is just not an Altcoin project or a "trading pair", this is actually the technology that will fuel our lives in the future... This will be worth a lot, specially in terms of cheap dollars.
Namaste.

🔥 ETC Moving To Bear Market ResistanceETC is one of the many alts who's currently underperforming the market. However, that doesn't mean that there's not trades to make.
I'm looking at the top dotted resistance line as a target. With continued market strength we might break out of the resistance, but that's something for later.

April for ETCAscending triangle breakout successfully and first target is 24 . If 24 resistance breaks then next target will be 30. If price breaks down the Red line then there are chances that price will not pump soon.

ETC/USDT - Ethereum Classic: Trend_Reversal◳◱ Hey traders, A Trend Reversal has been identified on the SET:ETC / CRYPTOCAP:USDT chart. The trend of the price has reversed, indicating a potential trend change. The next resistance levels are located at 21.48 | 22.39 | 24.13, while the main support levels can be found at 19.74 | 18.91 | 17.17. Consider buying at the current price of 21.14 and benefiting from the trend continuation.
◰◲ General info :
▣ Name: Ethereum Classic
▣ Rank: 25
▣ Exchanges: Binance, Kucoin, Bybit, Huobipro, Gateio, Poloniex
▣ Category/Sector: Infrastructure - Smart Contract Platforms
▣ Overview: Ethereum Classic is a decentralized computing platform designed to execute smart contracts, which are applications that run as programmed without the possibility of censorship or third-party interference. It is a distributed network consisting of a blockchain ledger, a native cryptocurrency (called ETC), and an ecosystem of on-chain applications and services. Ethereum Classic is the legacy chain that split from Ethereum following a contentious hard fork, known as The DAO fork, in Jul. 2017. Like its sister chain, Ethereum Classic features an execution engine optimized for smart contract processing (known as the Ethereum Virtual Machine or EVM) and a Proof of Work (PoW) consensus system. While it shares some aspects with Ethereum, Ethereum Classic offers a more defined monetary policy and inflation schedule.
◰◲ Technical Metrics :
▣ Mrkt Price: 21.14 ₮
▣ 24HVol: 15,065,869.507 ₮
▣ 24H Chng: 4.241%
▣ 7-Days Chng: 0.07%
▣ 1-Month Chng: 12.12%
▣ 3-Months Chng: 3.06%
◲◰ Pivot Points - Levels :
◥ Resistance: 21.48 | 22.39 | 24.13
◢ Support: 19.74 | 18.91 | 17.17
◱◳ Indicators recommendation :
▣ Oscillators: SELL
▣ Moving Averages: STRONG_BUY
◰◲ Technical Indicators Summary : BUY
◲◰ Sharpe Ratios :
▣ Last 30D: 2.91
▣ Last 90D: 0.49
▣ Last 1-Y: -0.11
▣ Last 3-Y: 0.97
◲◰ Volatility :
▣ Last 30D: 0.74
▣ Last 90D: 0.69
▣ Last 1-Y: 1.11
▣ Last 3-Y: 1.22
◳◰ Market Sentiment Index :
▣ News sentiment score is N/A
▣ Twitter sentiment score is 0.67 - Bullish
▣ Reddit sentiment score is 0.75 - V. Bullish
▣ In-depth ETCUSDT technical analysis on Tradingview TA page
▣ What do you think of this analysis? Share your insights and let's discuss in the comments below. Your like, follow and support would be greatly appreciated!
◲ Disclaimer
Please note that the information and publications provided are for informational purposes only and should not be construed as financial, investment, trading, or any other type of advice or recommendation. We encourage you to conduct your own research and consult with a qualified professional before making any financial decisions. The use of the information provided is solely at your own risk.
▣ Welcome to the home of charting big: TradingView
Benefit from a ton of financial analysis features, instruments and data. Have a look around, and if you do choose to go with an upgraded plan, you'll get up to $30.
Discover it here - affiliate link -

ETC/USDT will soon present a buying opportunity."Etcusdt
The price of ETC/USDT might go up soon because it's forming a bullish Symmetrical pattern on the daily chart.
But on the 4-hour chart, there's a bearish pattern which suggests the price might drop before going up. it's possible that the price could drop more before going up.
"I am expecting a small price drop at the moment, and my preferred buying zone is the area that I've marked on the chart."
Please keep in mind that our ideas are based on our experience and knowledge, and may not be completely accurate as the market is always unpredictable and anything can happen at any time. It is essential to conduct your own research and use your own knowledge when trading. If you are happy with our work, join us

AAVE BREAKOUT INCOMING (Hidden Bullish Divergence on 4 HR)AAVE is about too rip. . Hidden bullish divergence on RSI and we are now starting to see some follow through via the price action beginning to take effect. Great looking chart that has all the ingredients for a upswing.

Ichimoku Analysis for ETCKeeping an eye on $ETC. Looking for a breakout here. Closing above 22.45 could help it zoom.

Cocos Getting ready for Another Bullish impulse Testing trendline In h4 Timeframe Incase Of Breakout expecting 30 to 35% bullish Move
look for buying opportunities after breakout

ETC IS BEARISHHi, dear traders. how are you ? Today we have a viewpoint to SELL/SHORT the ETC symbol.
For risk management, please don't forget stop loss and capital management
When we reach the first target, save some profit and then change the stop to entry
Comment if you have any questions
Thank You

ETCUSDT LONG SETUPETC is showing us weakness, I think it is giving falling signals. I expect it to return at least to the support line. But this is my setup for a temporary long.

Ethusdt Looks Promising For Midterm Seems Like Eth Is Ready For Massive Recovery In Coming Weeks
Descending Broadening Wedge & Symmetrical Triangle breakout Has Already Confirmed In 2days Timeframe Expecting Massive Bullish Moves In coming Months
our 1st Target would be 2300 2nd 3400 3rd & Final Target will be 4600

ETCETC technical analysis:
Friends, the harmonic bullish pattern is marked with targets. This analysis is valid until I give a correction analysis of Bitcoin.
The main point is that the targets have been identified in this analysis and now it is not optimal for buying.
Good luck
Karim Heydari

ETC ETC looks bullish after the breakout you enter to get some profits
its 1D frame so takes some time
peace:)

✴️ Ethereum Classic Update | Long-Term GrowthSomething is happening here with the Ethereum Classic chart that reveals a bright future.
Notice that back in July 2022 ETCUSDT only lasted a few days above EMA100 consolidating before moving forward.
This forward move was then followed by a strong correction which ended in a higher low.
This time around things are much difference.
Ethereum Classic consolidated above EMA100 but failed to move ahead, it went on to produce a correction yet still, within short-term and long-term higher lows.
This is a revealing fact.
We might be looking at the last time that Ethereum Classic will be available at these low prices in its existence.
For example, $12.5 USD as in June 2022 is already forever gone.
The longer a pair consolidates, the stronger the breakout.
The next time ETCUSDT moves up and peaks, instead of a strong correction to produce a higher low we can end with a long sideways consolidation phase before the next bullish jump.
Or the consolidation can have a downward slope as in a falling wedge pattern but still remaining multiple levels higher compared to now and then growth.
And this cycle repeats over and over for years to come.
Namaste.

RLinda ! ETCUSD->Attempting to break through years of resistanceETC Etehreum classic breaks through the strongest resistance line, which has been holding back the price for several years. If this attempt is successful, then in the medium term, the coin can make the growth of 60%, 120% and 160%. What's next?
ETCUSD stopped its fall in the support area at 12.0-16.0 and the price gained some energy and potential to grow, which might burst out soon.
The key resistance zone is 22.00-23.00, if the price remains above this area, it will open the way to 36.00, 48.00 and in the long term it might reach 54.00 .
Sincerely R.Linda!

EthereumClasic Weekly View - March 2023Hello Guys, Weekly Analysis is on the ETCUSDT Symbol in a 1H Time frame, I Hope it Will be Useful for You, Don't Forget to Like, Follow, Comment
