ETCUSDT Hi traders! as drawn the trendline in my analysis ,Maybe we can get up to 35 🧑🚀 and then go down to the areas 18/16
Etc


ETC LONG IDEAI will not enter trade alredy expose in 2 trades KDA and BTG
risk 1%.
4h trading time frame.
we have two targets:
targe 1 : inside bull flag
target 2 : base in 4h fibonnachi
tradable pattern: SHORT TERM UPTREND
Positive arguments
+forming bull flag with ABC cirection
+CTB counter trend line brake (orange line)
+short term uptrend
+potencial H&S formation
+1D bullish candel stick formation
+bounce from past support (BLUE AREA)
+4h original fibonnachi with confirmed C

🔥 What heppen to ETC after the MERGE? BULLISH FLAG breakout🚩Hi friedns! ETC is moving in the huge bull flag. Let`s talk about the most potential scenarious for the ETC price.
Ethreum Classic is the oldest ETH fork and we see how it`s following the ETH price. Huge dump of ETC happen at the same time after the ETH MERGE. Even if other altcoin make a reverse, the price of ETC will follow the ETH.
✅ After this correction i can expect some pullback. The price fall to 2 important support levels:
1️⃣ the bottom boundary of the bullish flag🚩
2️⃣ the huge value area of $25-28
📊 When you should open a long:
🔥 the whales liquidity collection (false breakout) below the bottom boundary of flag
🔥 the volume growth during the false breakout which confirms the pressense of whales
🔥 DOM and Footprint confirmation of the big orders to BUY at the bottom. These scalping tools help me to identify the whales who want to trap the retailers. In the most cases the bounce from this size lead to the pump and you make 1:5-20RR trades.
🔥 bullish BTC force all the altcoins reach the targets
✅ The closest target is the top boundary of the of the bullish flag ($36-38)🚩 The huge value area are also there, so you can book 50-70% of your profit. The pullback is hughly expected.
🚩 If the price fall below the value area of $25-28 and BTC will be bearish, ETC easilly reach the $15-16. In this case we can open our short on the test of the flag or this value area as the resistance with short sl and nice RR.
💻Friends, press the "boost"🚀 button, write comments and share with your friends - it will be the best THANK YOU.
P.S. Personally, I open an entry if the price shows it according to my strategy.
Always do your analysis before making a trade.

ETC - Over-Sold Zone!Hello TradingView Family / Fellow Traders. This is Richard, as known as theSignalyst.
ETC is overall bearish trading inside the brown channel, however, it is now approaching the lower brown trendline acting as a non-horizontal support zone .
Moreover, the zone 23.0 - 25.0 is a strong support and demand zone.
So the highlighted purple circle is a strong area to look for buy setups as it is the intersection of the green support zone and lower brown trendline. (acting as non-horizontal support)
As per my trading style:
Since ETC is around the purple circle zone, I will be looking for bullish reversal setups (like a double bottom pattern, trendline break , and so on...)
Always follow your trading plan regarding entry, risk management, and trade management.
Good luck!
All Strategies Are Good; If Managed Properly!
~Rich

ETC still have a correctionI don't think Ethereum Classic is ready to rise yet, and it seems that the correction of this currency will continue

ETCUSDTETCUSDT
Is it at support level expecting move higher the rsi is also bottomed
Yellow line are tp for reference

ETHW & ETC AWESOME FRACTAL! MIGHT WANNA LOAD UP ON ETHWI went back to when Ethereum Classic originally forked from Ethereum back in the day and wanted to see what the price action was like then to see if I could compare it to the new fork ETHW . What do you know the fractal looks eerily similar just on different time frames. Might be a good potential long here on ETHW . This is not trading or financial advice this is just my opinion. Thank you

ETHW & ETC AWESOME FRACTAL! MIGHT WANNA LOAD UP ON ETHWI went back to when Ethereum Classic originally forked from Ethereum back in the day and wanted to see what the price action was like then to see if I could compare it to the new fork ETHW. What do you know the fractal looks eerily similar just on different time frames. Might be a good potential long here on ETHW. This is not trading or financial advice this is just my opinion. Thank you.

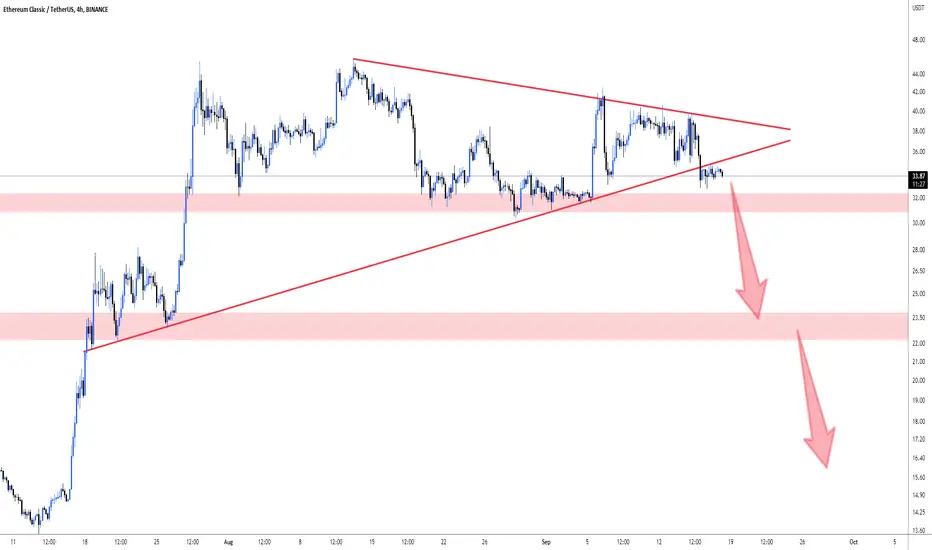
ETCUSDT Bear Flag Broken to downwardETC Bear Flag Broken
Trade is going according to the plan. ETC need to break 27 for further down. 25-27 is critical area and after break it can go down to 15-18
Use your money carefully and don't be greedy. Its just my opinion, not a financial advice.
Thank you and Good Luck!

ETHW DCA ...ETHW is good old ETHEREUM proof of work. Transactions need to be mined by GPU by HARD WORK.
Proof of work is most secure form of blockchain.
Numbers are COMPUTED (WORK) not only validated (as proof of stake).
- So ETHW needs to settle down and stabilize.
- There is not much TA to do.
- This coin is to be to buy dollar cost averaging.
- Volume increasing
- It has upward potencial ...
Im not only one who think same way ...

Ethereum Classic (ETC) 1DAY UPDATE BY CRYPTOSANDERS !!Hello dear traders, we here new so we ask you to support our ideas with your LIKE and COMMENT, also be free to ask any question in the comments, and we will try to answer for all, thank you, guys.
Ethereum Classic (ETC):-one of the most notable movers on Monday, as the token fell by over 12% to start the week.
Following a high of $33.41 during the weekend, ETC/USD slipped to an intraday low of $27.91 earlier today.
The drop comes less than a week after Ethereum classic was trading above $40.00, ahead of last Wednesday’s Merge.
Monday’s drop sees ETC move to its lowest point since July 27, when the token was trading near $24.00.
As of writing, earlier price declines have eased, with ETC now back above the $30.00 mark.
After a brief breakout, the 14-day relative strength index (RSI) is also tracking marginally above support of its own at 40.95.
Sorry for my English it is not my native language.
Hit the like button if you like it and share your charts in the comments section.
Thank you

ETCUSDT Long SignalOne of the most searched coin right now and is a killer gem which is ready to explode in the upcomming days, the ETCUSDT is about to take a LONG.
My Setup for this is:
$23.8 - $31.5
One Time Entry: $28
Short Term: 31 , 32.5 , 36 , 38, 42
Mid Term: 48, 52, 61, 69
Long Term: 75, 81, 86, 95
: 20.75
Please be aware with your money!

ETCUSDT | Well, miners, are they mining?Hello trader Today I prepared a new idea for you. Like and subscribe to the channel there is a lot of useful information✅
Friends from the last signal, we never came to test the countertrend one.
While you can see that the asset is starting to consolidate in the range of $33-35, I think from this zone you can try to gain a long position for a small percentage of the deposit (3-5%)
ETH is still gaining momentum but it could be a trap, I wrote about it in another post! So be careful and work with risk management!

ETH: ACCTIVED FOR NEW DAY TRADINGETH: ACCTIVED FOR NEW DAY TRADING
it seems ETH can have new increase

ETC ready for longterm FLY!ETC is ready to fly. ETC broke out of a long-term bearish channel and hit a nice pullback. No matter what happens to the bloody cryptocurrency market in September, but considering the end of the Ethereum mine, this chart is a spectacular chart!

ETC | Bullish Flag? Will The Price Rise More?ETC | Bullish Flag? Will The Price Rise More?
As we all know when the news about the ETH merge and the
upgrade from POW to POS we saw that ETC made a very nice bounce.
All was related with the fact that the miners would have moved from ETH to ETC
or other coins and ETC had higher chances for mining.
However, the market is still expecting and the situation is not clear yet with ETH Fork etc
and now ETC is still waiting.
The price is developing a very big bullish flag pattern.
For some time I am expecting the price to move between 30.5 and 45.40
The price can develop in this area for a long period of time.
Once the price jumps above 45.5 it means that something good happened
and the price should continue to grow more.
Thank you and Good Luck!

ETCHELLO GUYS THIS MY IDEA 💡ABOUT ETC is nice to see strong volume area....
Where is lot of contract accumulated..
I thing that the buyers from this area will be defend this long position..
and when the price come back to this area, strong buyers will be push up the market again..
UPTREND + Support from the past + Strong volume area is my mainly reason for this long trade..
IF you like my work please like share and follow thanks
TURTLE TRADER 🐢

Ethereum Classic (ETC) !W scenerioScenerio 1
Short if next wee candle ends in red forming a continuous bearish trend pattern
Scenerio 2
Long if next week candle end in green, breaking the bearish trend line. Wait to bullish reversal candle stick pattern

$ETC - Number Go Up 🚀🚀Short and medium term PTs for $ETC; Using fibs and traditional TA.
Catalyst: $ETC hashrate to the moon.

ETC CAN PROFIT THE MOST FROM MERGE!ETC is one of the coins that can profit from the merge, and even more then ETH in %.
There are different reasons why ETC is the one that can benefit from this merger.

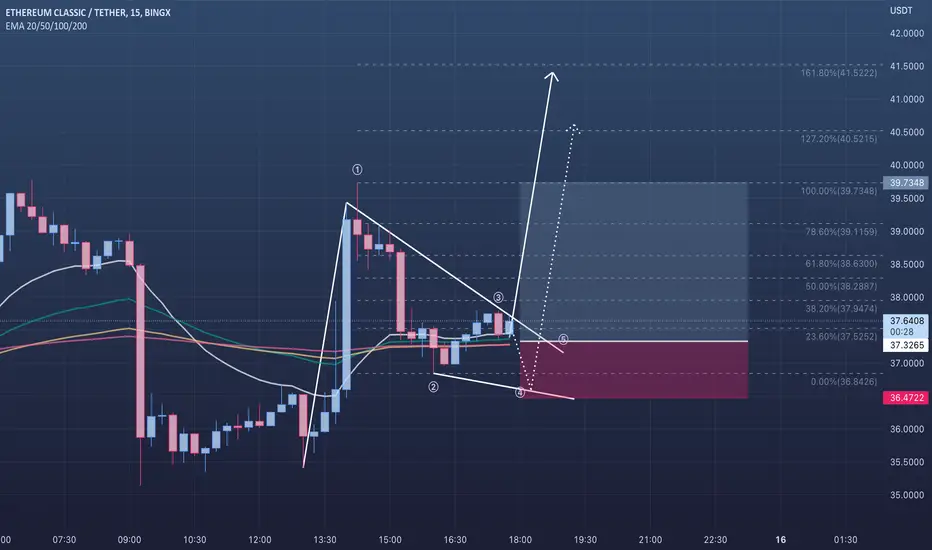
🟢 ETCUSDT - 15M (15.09.2022)ETCUSDT
TF: 15M
Side: Long
Pattern: Cup + Handle / Bull Flag (Potentially)
Entry: Between $37.3265 & $36.4722
SL: $36.4722
TP 1: $37.5252
TP 2: $37.9474
TP 3: $38.2887
TP 4: $38.6300
Possible bullish flag formation on 15M on the back of a cup and handle.