Ethereum Classic 8X Trade-Numbers (6,480% Potential)The longest consolidation phase ever is still happening. This is positive for the upcoming bull-market. The longer it takes for Ethereum Classic to move forward, the stronger the growth when it does.
The profits potential on the title is based on a $183 conservative target. As you can see on the chart, ETCUSDT can reach $282 or even $450 or higher. What is important here is the entry and long-term hold.
Let's do some maths:
5X with a $20 entry and a target at $300 would equal to 1,400%. That would be a total 7,000% growth potential with 5X at current price. ETCUSDT.
Another example is 7X, same entry and a target of $444. That would be a huge 14,840% potential if such a target is hit. Without leverage, that would be 2,120%, from $20 to $444.
Below you can find more conservative numbers but still very strong.
_____
LONG ETCUSDT
Leverage: 8X
Entry levels:
1) $21.1
2) $20.1
3) $19.1
Targets:
1) $25.8
2) $27.6
3) $31.2
4) $37.1
5) $44.9
6) $52.5
7) $63.5
8) $77.2
9) $92.8
10) $102
11) $117
12) $128
13) $142
14) $160
15) $183
Stop-loss:
Close monthly below $18
Potential profits: 6480%
Capital allocation: 5%
_____
Something important, once the initial bullish breakout happens, the first jump, there is no going back. Once this move happens, Ethereum Classic, Bitcoin and the entire market will never be the same. The lowest prices after the end of this incoming bull-market will be many times higher compared to what we are seeing today. It is truly the last chance to see Crypto at a discount, trading this low. Once the market starts to move, it will a new world.
Hundreds of thousands of new millionaires will be created. A new economy, the nouveau rich, it will be a different world.
It is not the same saying, "the market is going up," vs experiencing this growth. When the next bull-market start, it will be wild, it will be crazy, it will be amazing and we will be rewarded big time for being early.
Anyway, I am ready for the biggest cycle since I started to write and trade. What about you?
Are you ready for change? Positive change.
It will be amazing. I am telling you.
Namaste.
Etc

ETC/USDT 1H Chart ReviewHi everyone, let's look at the 1h ETC to USDT chart, in this situation we can see how the price has fallen below the uptrend line, and what's more we can see the first attempt to return above the trend line, however we can see the place that rejected the price.
Let's start by defining the targets for the near future that the price has to face:
T1 = 20.79 USD
T2 = 21.09 USD
Т3 = 21.60 USD
Т4 = 21.95 USD
Now let's move on to the stop-loss in case the market continues to fall:
SL1 = 20.19 USD
SL2 = 19.73 USD
SL3 = 19.26 USD
SL4 = 18.90 USD
On the Stoch RSI indicator we can see how the energy is decreasing and staying in the lower part of the range, keeping the price from a bigger drop for now.

Name Your Cryptos ! I’ll Analyze the Most Voted Picks!Tell me the coin name, and I'll analyze it for you!

END of TOP for CRYPO MARKET, BEARISH TREND #BTC 2-02-25Bearish trend, expect bounce up on 1h timeframe. Generally Crypto market in bearish trend. After double top on bitcoin, it is end of latest bull trend, we are on the bearish reversal trend!
#BTCUSD #BCHUSD #ETHUSD #ETCUSD #ADAUSD #TONUSD #SOLUSD
Thank you and Good Luck!

TradeCityPro | ETCUSDT Buyers and Sellers War👋 Welcome to TradeCityPro Channel!
Let's go together in the final hours of the week and the financial markets are closed. Let's analyze and review another of our altcoins in a short and concise manner.
🌐 Overview Bitcoin
There is no need to include Bitcoin analysis in this analysis because I analyzed Bitcoin in detail for you today. I will put the link below. Be sure to check it out and pay attention to its chart.
📊 Weekly Timeframe
In the weekly time frame, ETC is one of the coins that is still fluctuating in its box range, but this time it has risen from the higher bottom of 17.67 and has not moved towards 14.90, which is a positive point.
I probably will not hold this coin for re-buying, but if you want to enter, I suggest you do so after the 37.16 break and follow this very closely as soon as possible. Don't happen in this time frame
On the other hand, if you bought with the 20.44 break, continue to hold for now, but the previous rejection from 37.16 is a good trigger for saving profit or exiting the main capital, and wait for the main exit and exit below 14.90
📈 Daily Timeframe
In the daily time frame, we are also suffering in the 24.71 to 28.12 range box, but the good thing is that we are one level above the daily box break box, which is 20.92, and we are in a better situation than the other coins that returned to this box.
I want to pay close attention to the 17.55 to 20.92 box, which is a complete daily range box, and you can see this in the weekly chart as well, and I want to show you that our purchase is after the box ceiling breaks and momentum and volume enter the chart and coin, which makes us stay in the position less and the fastest way Take our potential profit from the market
To buy again, you can make your purchase after the 24.71 break with the momentum I just explained, but your main trigger in higher time frames is the 38.24 break and it is better to involve your main risk there. If you intend to buy, you can also enter at 28.17 as a risk to have an entry point.
I do not recommend below 24.71 for the exit, but if you want to exit, if we return to the box again, make your purchase at the same number of dollars you sold, and your main exit trigger will be below 14.67.
Now you may be wondering why the daily resistance is at 28.17. The reason is a fake breakout that happened. The previous series and the fake breakout are exactly these two candles that go above the box and return exactly. Even if we remove them, nothing special will happen on the chart and the data will be wasted.
📝 Final Thoughts
Stay calm, trade wisely, and let's capture the market's best opportunities!
This analysis reflects our opinions and is not financial advice.
Share your thoughts in the comments, and don’t forget to share this analysis with your friends! ❤️

etc longterm buy"🌟 Welcome to Golden Candle! 🌟
We're a team of 📈 passionate traders 📉 who love sharing our 🔍 technical analysis insights 🔎 with the TradingView community. 🌎
Our goal is to provide 💡 valuable perspectives 💡 on market trends and patterns, but 🚫 please note that our analyses are not intended as buy or sell recommendations. 🚫
Instead, they reflect our own 💭 personal attitudes and thoughts. 💭
Follow along and 📚 learn 📚 from our analyses! 📊💡"

ETC On Vital Trendline Retracement !Ethereum Classic (ETC/USDT) is showing promising signs of bullish momentum following its breakout from a descending triangle formation. The price is currently consolidating above the trendline, indicating that the breakout level is holding as a strong support. This consolidation phase often precedes the next leg of a price movement, as the market builds strength for a potential continuation.
At the current price of $27, Ethereum Classic appears to be in a retesting phase. This is a critical moment where the price tests the breakout level to confirm it as support. Successfully holding this level would reinforce the validity of the breakout and provide confidence for further upward movement.
A significant factor to watch here is volume. A notable spike in trading volume would signal strong buying pressure, which could drive the price higher. If this occurs, the next resistance to overcome lies around $31, and surpassing that could lead ETC toward the $35 to $40 range, based on historical price action and the measured move from the triangle breakout.
If the price fails to maintain support above the $25.50-$27 range, it could lead to a deeper pullback, invalidating the bullish scenario. This makes the current consolidation phase a crucial moment for traders to watch.
Ethereum Classic is positioned for a potential upward move, provided it holds above the trendline and volume supports the breakout. Patience and vigilance are key as the market awaits a decisive push.

ETC LongETC looks amazing.
23$ is one of the most important levels on this chart. For the past 4 weeks ETC has been regarding it as support.
- Bullish Divergence on both oscillators and all higher time frames.
- Bullish Dragon broken and backtested at support.
- Rising volume after consolidation and break of the spine.
- Holding 23$ as support and the 200MA.
- Weekly reversal candles confirmed for now.
Most coins don't look great, but this one does. I'd be cautious and not over allocate.

ETC Bullish ScenarioEthereum Classic has a huge potential for a bullish movement toward a new all-time high across multiple possible scenarios as long as the price holds above $17.4, which is the stop-loss. Breaking this level would invalidate this bullish idea.

Alikze »» ETC | Scenario 3 or C bullish - 1W🔍 Technical analysis: Scenario of wave 3 or C in the ascending channel
BINANCE:ETCUSDT In the daily timeframe, according to the analysis presented earlier , it encountered demand after reaching the Buyer zone, which led to the breakdown of the descending channel and the touch of the target of $25.
- Currently, after exiting the congestion, it is moving within an ascending channel, which is currently at the ceiling of the first channel.
💎 In case of correction, at the ceiling of the first ascending channel, it can encounter demand in the middle range of the channel or the OB zone and continue its growth to the ceiling of the second channel.
⚠️ In addition, in the bullish scenario, the Invalidation LVL zone should not be touched. ⚠️
💎In case of touching the mentioned zone, the currency's movement path should be reviewed and updated again.

ETC/USDT - 1W interval Chart Hello everyone, I invite you to review the ETC pair to USDT chart, taking into account the interval of one weekend.
As we can see, the price is currently in the support zone from the level of $25.60 to the level of $24.27, but if the zone is broken, we still have visible support at the level of $21.85 and then we can see a drop to the level of $17.55.
Looking the other way, when the trend reverses, the important resistance level is $29.35, then the resistance level is $33.30, and the next significant level is $36.26.

ETC LONGAnalysis:
We are currently observing an accumulation phase in the market as the price tests a significant support level. This area is crucial for determining if the market will rebound or break further down.
The monthly open is highlighted, showing that price action has been trading below this level.
A potential breakout to the upside is expected, with the conservative target set around $32. This aligns with previous resistance zones, where price has struggled to break above.
If the price breaks above the $32 mark, the next potential target would be near the PMH (Previous Monthly High) at around $40.
Trade Plan:
Buy at current price levels near $24.34 with a stop loss just below the support (around $21).
Target 1: $32 (Conservative Target)
Target 2: $40 (PMH)
Risk Management:
Keep stop-loss orders below the accumulation zone to limit risk in case of a breakdown.
Note:
This setup is based on technical analysis and assumes that the market continues to show signs of a bullish reversal. Keep track of broader market trends and adjust accordingly.

ETC LongThe Accumulation Phase (2023-2024) shows a significant period of consolidation between late 2023 and 2024, where the price remains within a range. This phase suggests a buildup of buying pressure, indicating a potential breakout.
The Re-Accumulation Phase (2024-2025) shows further consolidation after the initial movement, preparing for the next upward move. This phase is important as it forms a solid base for potential price advancement.
A break above the MSB level could signal stronger upward momentum.
Potential Target: The chart projects that a breakout above the MSB could lead to a sharp price movement, with potential targets near $65
Overall Outlook: The chart reflects a well-planned accumulation phase with an expected bullish trend if price can surpass the MSB level.

etcusdt midtem long"🌟 Welcome to Golden Candle! 🌟
We're a team of 📈 passionate traders 📉 who love sharing our 🔍 technical analysis insights 🔎 with the TradingView community. 🌎
Our goal is to provide 💡 valuable perspectives 💡 on market trends and patterns, but 🚫 please note that our analyses are not intended as buy or sell recommendations. 🚫
Instead, they reflect our own 💭 personal attitudes and thoughts. 💭
Follow along and 📚 learn 📚 from our analyses! 📊💡"

Little Ethereumhello friends
Considering the higher floors that this token has reached and the growth that it has had, it has now corrected to half of its upward movement, which is an opportunity to buy a step, and in case of further correction, the second step is determined...
We have drawn the targets for you in order.
Note that this currency moves with Ethereum and its main growth has not yet started...
Be successful and profitable.

ETCUSDT 1WETC Update ~ 1W
#ETC Entering the Bullish phase., If you still have Conviction on this coin,. Buy gradually on this Golden Fibonacci. With a minimum target of 20%++
etc usdt"🌟 Welcome to Golden Candle! 🌟
We're a team of 📈 passionate traders 📉 who love sharing our 🔍 technical analysis insights 🔎 with the TradingView community. 🌎
Our goal is to provide 💡 valuable perspectives 💡 on market trends and patterns, but 🚫 please note that our analyses are not intended as buy or sell recommendations. 🚫
Instead, they reflect our own 💭 personal attitudes and thoughts. 💭
Follow along and 📚 learn 📚 from our analyses! 📊💡"

etcusdt Ethereum bitcoin "🌟 Welcome to Golden Candle! 🌟
We're a team of 📈 passionate traders 📉 who love sharing our 🔍 technical analysis insights 🔎 with the TradingView community. 🌎
Our goal is to provide 💡 valuable perspectives 💡 on market trends and patterns, but 🚫 please note that our analyses are not intended as buy or sell recommendations. 🚫
Instead, they reflect our own 💭 personal attitudes and thoughts. 💭
Follow along and 📚 learn 📚 from our analyses! 📊💡"

Ethereum Classic ETC price is just starting to riseGod willing, we will be able to see CRYPTOCAP:ETC at $50 in this growth wave
Then a slight correction and a possible breakout of the OKX:ETCUSDT price to storm $100
At the moment, the #EthereumClassic price is forming a pattern very similar to the one that #Dogecoin used to form, don't you think? 👇
_____________________
Did you like our analysis? Leave a comment, like, and follow to get more

etherium classic etc usdt daily analyses
time frame daily
risk rewards ratio >1.5
although today we heard a lot about alt season but
my analyse is base on price action and support and resistance
etc moves up and down in parallel lines and my target is top of that.
we have 2 resistance boxes ( red boxes in the chart ) ,if ETC can break those boxes , it can pump to 39 $

Ethereum Classic ($ETC) will show a classic H&S patternEthereum Classic is one of the few old assets that has yet to fire. It will follow the same scenario as XRP, LINK, XLM and others. I love the Head and Shoulders pattern that the market maker often plays on old assets. The simplest reason why Ethereum Classic is being pumped is its age. The global market maker has been accumulating old assets for a large number of years and it's time to reveal the cards. I expect a price hike to the area of 170-180$ and further correction.
Best regards, Horban Brothers.

Alikze »» FTM | Suspicious of the reverse head and shoulders🔍 Technical analysis: Suspicious of the reverse head and shoulders pattern
- In the analysis presented in the previous post, the target exactly touched the bottom of the channel, which then met demand and caused a 110% growth.
- Considering that the recent corrective wave had a correction of 0.23 fibo of the previous wave, so we should expect an upward trend.
- In addition to the fact that the recent corrective wave was a three-wave and its corrective momentum was in the form of three waves, if its correction is not complex in combination, we can expect the continuation of the upward trend after a short-term correction.
- Therefore, the first target of the neck line can be considered the first supply area. After defeating the supply area, the next targets will become available.
💎 In addition, you should pay attention to this point, in order to verify the upward trend, the previous floor should not be touched (Invalidation LVL range), in which case the analysis will be invalid.
»»»«««»»»«««»»»«««
Please support this idea with a LIKE and COMMENT if you find it useful and Click "Follow" on our profile if you'd like these trade ideas delivered straight to your email in the future.
Thanks for your continued support.
Best Regards,❤️
Alikze.
»»»«««»»»«««»»»«««
BINANCE:FTMUSDT

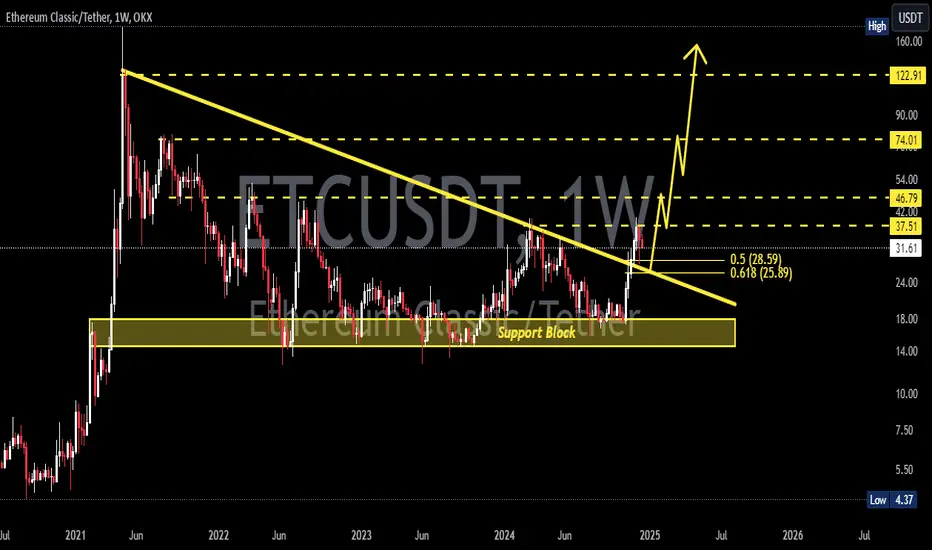
Ethereum Classic: A Breakout That Could Ignite a New Bull RunEthereum Classic (ETC/USD) has broken out of a multi-year descending trendline, signaling a potential shift from prolonged consolidation to a new bullish phase. This breakout ignites optimism among long-term investors, suggesting that the long-awaited rally might finally be here.
A Fibonacci projection highlights the 1.618 level at $274 as a key long-term profit target, representing significant upside potential from current levels near $36.50. This technical milestone could attract fresh interest in ETC, positioning it as a standout performer in the crypto market.
For long-term holders, this breakout marks a pivotal moment, offering renewed hope of ETC reclaiming its strength. While challenges may arise, the current move sets the stage for a potential historic rally, making this a critical time for investors to remain optimistic and informed.
**Disclaimer:**
This post is for informational and educational purposes only and should not be considered financial or investment advice. Cryptocurrency investments are highly volatile and involve significant risk. Always conduct your own research and consult with a licensed financial advisor before making any investment decisions. Past performance is not indicative of future results.
