Ethereum active channel. ETH review !#ETH
▪️ Deadline for the deal is 5 days. Ethereum moves in the channel (marked on the chart). It can work out the "Bearish Flag" pattern. Look carefully at the chart!
In order not to miss a buy signal, subscribe and stay tuned for new ideas. Every day I post 10 profitable ideas a day.
Etc

Ethereum Classic Targets $77 (195% Profits Potential)This is why we focus our trades on the smaller altcoins rather than the big ones.
Smaller capitalized altcoins have higher potential for growth.
After a stop-loss hunting period, ETCUSDT had a strong volume breakout and is ready to move up.
$37 Is the easy target, still big growth.
We can see it going up to $77 and that's a huge 195% potential from the current level we are on.
This is my first DEX trade and it is paying really well...
I am very happy -extremely GRATEFUL- with the results.
I can be impatient in mind, playing in my mind saying to myself that I am impatient, but the trades... I do not touch.
I wait and wait and wait, patiently...
And only sell when the next resistance hit.
That's a sure and easy way to win.
Thank you for reading.
No need to comment.
No need to "boost"...
All that is needed is that you use this information for your own success.
That you profit from this information or that you learn something or in the least feel entertained.
Everybody has to do their own research.
There is always the potential for loss.
Trading involves risk.
If you can't take a loss, this business is not for you.
But if you can, that's part of the game and as you learn you will win long-term.
Thank you for reading.
This is Alan Santana!
I am wishing you the best, now & always.
Namaste.

ETC play book training exerciseThis is more of a training exercise then actual reliable TA.
I have mapped out 3 different paths i personally believe ETC can take in the coming days.
Purple Most likely to Play out
Green 2nd Most Likely to Play out
Yellow Least Likely to Play out
I could also be dead wrong and we drop to the floor.
My goal here is to see if out of the three options any of them have a good success rate.
Then I will be able to learn which direction to take my TA.
Thanks for viewing!

ETC broke down rising wedge#ETC/USDT
#update
$ETC broke down and done its pullback to confirm the support zone as resistance.
also RSI below HMA is a bearish sign.
🐻 so it seems bears are in control

ETC rising wedge#ETC/USDT
$ETC shaped a rising wedge pattern. but it is above support zone
🐻 break down the lower zone can drop price to 0.5 and 0.618 fib levels.
🐮 break out the upper line can reach price to around $35

ETC 15m short scalpi have two scenario in mind , let me know what you think in the comments!
scenario 1: ETC will come to the zone and then after a nice bearish candle we will get in
(confirmation candle gives us the stoploss location)
scenario 2: ETC will break down the channel and then after a pullback to the lower zone we get in
(place your stop loss above the confirmation candle)

Ethereum correction. ETH short reviewDeadline for the deal is 7 days. ETH has formed a double top, this pattern is reversal, I think we will go down on the chart in the near future. (see chart)
In order not to miss a buy signal, subscribe and stay tuned for new ideas. Every day I post 10 profitable ideas a day.

ETCUSD Struggling to break the 1D MA200Ethereum Classic (ETCUSD) has been trading within a long-term Channel Down since late May 2021. This full year of rejections has seen the price make a Lower Low on the -0.236 Fibonacci extension level every time. The Lower High usually comes around the 0.618 Fib, marginally below which the price is now.
In fact, it is struggling to break above the 1D MA200 (orange trend-line), after the rejection on July 19. Technically, with the 1D RSI rejected above the overbought region, this is a sell signal towards at least the 1D MA50 (blue trend-line). Even a marginal break above the 0.618 will still be a sell signal. Make sure you always have the SL tight as the closer we get to the Lower Highs (top) trend-line of the Channel Down, the more likely a break-out becomes. The way it is now, a break above the top (around 41.00 now) signals a complete shift to bullish sentiment on the long-term.
--------------------------------------------------------------------------------------------------------
** Please support this idea with your likes and comments, it is the best way to keep it relevant and support me. **
--------------------------------------------------------------------------------------------------------

ETCUSDT(Ethereum Classic) Daily tf Range Updated till 22-07-22ETCUSDT(Ethereum Classic) Daily timeframe range. for any alt quality volume and retail interest are big factors. we can see both into this chart. and for that the price action been reasonable here too. provided swing setups , position setups and scalp setups. of course as its alt there will be always risk. but there are levels of risk. compare to many other alts out there with bat shit crazy price action there are very few with reasonable price action.

BITCOIN New Support Zone; 2HAs we can see in the Bitcoin chart in the 2-hour time frame, it is correcting after breaking the previous peak, and now we expect more growth if the upward trend line is maintained and the new support range is maintained. If these two ranges are broken, the analysis will be updated.
Its not Buy or Sell SIGNAL
DYOR
BY : Mohamad Teriz - @AtonicShark

$ETC Short on the 3hETC short with 5R potential. The higher the R:R, the less likely price is to reach that level.

$ETC SHORTA short I'm seeing, with 5R potential. The higher the R:R, the less likely it is to reach that price.

BITCOIN Breaking ChannelIn the previous analysis of Bitcoin, we mentioned the ascending channel of Bitcoin and said that you should not enter into the transaction until it breaks. Well, now this channel is broken up and if the price supports it, it can go up to $26,000. I specified possible scenarios according to the new support range in the chart.
Its not Buy or Sell SIGNAL
DYOR
BY : Mohamad Teriz - @AtonicShark


ETC $50 & $80 Targets in 2022ETC $50 & $80 Targets in 2022.
Take position after breakout and pullback.

Ethereum Classic ETC short Entry Range, Take Profit and Stop LosETC/USDT short
Entry Range: $24.00 - 25.50
Price Target 1: $19.80
Price Target 2: $17.00
Price Target 3: $13.50
Stop Loss: $27.80

ETC/USDT ShortOur chart is indicating bearish path for etc in the next few days. Why?
- There is a possibility we do a breakout on the trendline and reverse from the Fib level&vp line last session. We will open a short signal up on confirmation ( at the trend line ) as the chart indicates!
Our take profit will be at the golden channel in the fib, it's a buy zone as it also contains pivot points support & Vp line.
Have a good day & I hope you like my scenario. keep it up y all

Ethereum Classic Grows 101% In 10 Days... Can Do More!ETCUSDT has grown by a massive 100%+ in the last (MASTER NUMBER 7) days but more growth is absolutely possible...
The give away signal on this chart is the huge volume.
Notice the last two candles...
The potential is on the chart and it goes all the way to 99% but personally we are happy at 38% from current price and maybe up to 65%, but we stay conservative and always secure profits along the way.
Everybody has their own system/strategy, their own best method on how to sell to maximized profits.
Make sure to withdraw as much as you need as your trades develop because what comes after the bullish wave, we don't know... Can be a classic retrace or something we are not prepared for.
Namaste.

Ethereum Classic (ETC) - July 19Hello?
Welcome, traders.
By "following", you can always get new information quickly.
Please also click "Like".
Have a good day.
-------------------------------------
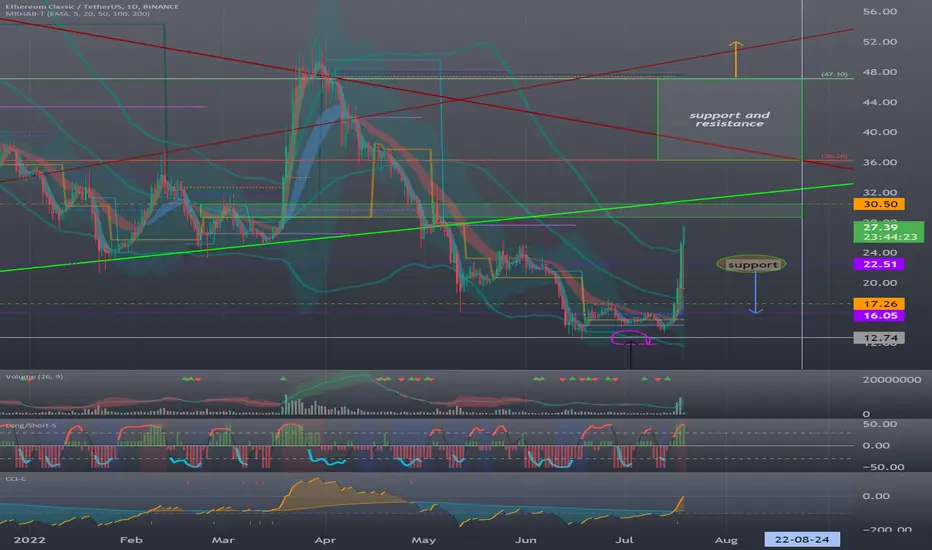
(ETCUSDT 1W Chart)
www.tradingview.com
If it touches the resistance section of 36.26-47.10 and falls below 30.50, Stop Loss is required.
(1D chart)
The key is whether it can move higher than 30.50.
To do that, we need to make sure we can keep the price above 22.51.
The interval 36.26-47.10 is the interval that determines the trend.
Therefore, if it is supported and rises in the 36.26-47.10 section, it is expected that the uptrend will continue.
If not, Stop Loss is required to preserve profit and loss when it falls below 30.50.
-----------------------------------------------
Why is the price rising and why is it falling???
You don't have to waste time trying to figure out the reasons for the rise and fall, because you don't know how far it will rise or how far down if you know the reason.
If you find a reason, you can create a basis for subjective judgment and proceed in a strange direction.
When the price rises, it is better to focus on which section to sell and check the movement of the chart.
You can respond based on whether you find support or resistance at the support and resistance points on the chart.
When you start trading, you sometimes overlook the current movement and unconditionally hold on to the desire to get more profit.
It is extremely rare and close to luck that such holdings can yield large returns.
It is often the case that after earning a large profit from such good fortune, they trade excessively and return the profit.
The stock market or coin market is an investment market that earns money by reacting.
Thus, it is a market that reflexively gains profit by identifying price movements and responding appropriately to reduce losses.
If you trade to get more profit, you will overlook the loss and end up trading with a big loss.
------------------------------------------------------------ -------------------------------------------
** All indicators are lagging indicators.
Therefore, it is important to be aware that the indicator moves accordingly as price and volume move.
However, for the sake of convenience, we are talking in reverse for the interpretation of the indicator.
** The MRHAB-T indicator used in the chart is an indicator of our channel that has not been released yet.
** The OBV indicator was re-created by applying a formula to the DepthHouse Trading indicator, an indicator disclosed by oh92. (Thanks for this.)
** Support or resistance is based on the closing price of the 1D chart.
** All descriptions are for reference only and do not guarantee a profit or loss in investment.
(Short-term Stop Loss can be said to be a point where profit and loss can be preserved or additional entry through split trading. It is a short-term investment perspective.)
---------------------------------
Ethereum Classic Price Analysis — July 18Ethereum Classic has tapped the critical $23.00 line for the first time since June 6, following a consecutive six-day rally. ETC also breached the daily 100 EMA for the first time since March and stands the chance of prompting a momentum change if it closes the day’s candle above this line. Better still, ETC could put $30.00 back into focus if it manages a candle close above the $23.00 mark.
However, the price appears to be in overheated conditions (see stochastic indicator), warranting some cautions on bullish bets. Regardless, the cryptocurrency stands a real chance of sustaining the newly acquired bullish momentum. As mentioned earlier, the price rejuvenation comes after the confirmation of a possible launch date for the Ethereum Merge upgrade.
Meanwhile, my resistance levels are $23.00, $25.00, and $30,00, and my support levels are $20.00, $18.00, and $17.00.
Total Market Capitalization: $1.01 trillion
Ethereum Classic Market Capitalization: $3.06 billion
Ethereum Classic Dominance: 0.3%
Market Rank: #24

Bitcoin Channel in 4HIn the previous analysis, we expected the price to increase in the 1-hour time frame, which hit the target, and currently, Bitcoin is in an ascending channel in the 4-hour time frame, which if it reacts to the channel ceiling, the possibility of falling to the bottom of the channel. we have. So, if you have an open position, it is better to save profit until the price goes off the ceiling.
Its not Buy or Sell SIGNAL
DYOR
BY : Mohamad Teriz - @AtonicShark

Bitcoin & Ethereum Will Follow | Ethereum Classic LeadsWe are aware that the cryptocurrency market is all correlated and all the cryptos tend to move together, specially the Tether (USDT) pairs.
Whenever Bitcoin goes bullish the altcoins USDT pairs also go bullish.
If Bitcoin crashes so does the altcoins.
This chart is for Ethereum Classic vs Tether (ETCUSDT), just notice todays candle.
It has really high volume, full green, trading above EMA50 and going straight up.
The ETCUSDT chart is also identical to Bitcoin and Ethereum in that the initial low was set 12-May followed by a lower low on 18-June.
A little tip on how to spot a bottom.
When a correction/bear market is taken place, prices dropping, volume tends to stay flat until a panic force comes in and volume grows strong on the first drop (12-May).
On the second drop which is a lower low (18-June) the volume becomes lower than the first one, this signals that the bottom is in (bear momentum loses strength).
Back to ETCUSDT, it is moving strong now while Bitcoin and Ethereum consolidate.
My theory is that Ethereum Classic won't move alone...
It only grows if the king grows.
In that case, Bitcoin and Ethereum are very likely to follow...
That's just my view of course.
But I will be here tracking the charts to see how it goes.
Namaste.

ETC 0.618 SHORT TO 0.618 LONGETC increased 13% today already. I think we have something to short at the level around 20$.
This erea has formed and supply zone and also the 0.618 golden pocket correction to the upside and its not touched before, so there will be a lot or orders to the downside.
After this potencial dip i personally will long it at the 0.618 Correction.
