Ethereum Classic ETC Price Targets and Stop LossETC/USDT short
Entry Range: $46 - 50.15
Price Target 1: $39.90
Price Target 2: $32.80
Price Target 3: $25.90
Stop Loss: $53.30
Etc

Ethereum Classic ETC short Price Targets and Stop LossETC/USDT short
Entry Range: $35.90 - 40.70
Price Target 1: $33
Price Target 2: $28.20
Price Target 3: $24.50
Stop Loss: $44.40
Previews short chart

Buy opportunity on ETC on 15mwaiting for pice to drop and touch the MPL zone and then we can long (Buy) ETC on 21.50 $ .
Always look simple to chart ...
let me know what you think on comments.

ETC BTCThe currency market is in recession due to the global recession and the Russian war. On the other hand, Bitcoin has not yet found its place in the world, although I believe that Bitcoin is the only way out of the global recession due to its structure and up-to-dateness. We will eat why we did not take this wealth seriously. The Atrium market trend is directly related to Bitcoin, and Bitcoin with its micro will see the price of $ 19, respectively, from today, and will see a correction up to the range of $ 24 and then probably $ 28. And it will continue to fall and stabilize below $ 19 and then move to $ 13, and if this happens, Atrium will continue to decline and the market will be out of its original price for a short time and all market participants will be afraid. The world news will take everyone to talk about biting ridicule, but the active scientists of this field will come in and face interesting platforms and will prove bitcoin and atrium by fighting against some rulers and policies, and again the rapidly growing movement and people The world will see the only way forward in the economy of using blockchain and witness it every day We will be a large shopping queue and this is where market participants will create a new phenomenon in the world for the people of the world. Of course, this process takes 3 years, which is not far from the mind. And daring to stay in this market will be the main winners

ETC/USDT Secondary Trend Pivot Area Triangle 327 (pennant)Huge pumping +3100% c accumulation (fractal repeat 2017 May). Rollback. Which formed a triangle with the base of 327% (potential upward pennant) in the case of a breakthrough resistance and upward price exit to the upper boundaries of the channel. Zones of levels to work showed on the chart.
The work is acceptable to traders (sham traders are not allowed as on DOGE). Tool for super profits smart people (partial reset with gift zone holding). Newcomers to trading or those people who even in the bull market manage to lose - find another tool to work with. Traders can make a lot of money.
Coin in coenmarket : Ethereum Classic
The main trend of this coin right now .
ETC/USDT Main trend.Triangle. Psychology. Pamp

[ALTCOIN]ETCUSDT TREND LINE ANALYSISHello, everyone
We're a team that specializes in chart analysis
We will always analyze and provide you with charts to help you sell
There are so many trading laws and there are so many good technologies that come with them, but I'm confident that the trend line is really strong.
If you read the point of view and get to know the line, every line will adjust
Thank you.
------------------------------------------------------------------------------------------------
Chart Analysis Content -
Candles continue to fail to cross the blue downward trend.
It is stable only when it rises above the white upward trend.
ETC is one of the few coins with very good angles to any line.
I think it will definitely go up even if I check the floor again.

Ethereum longEthereum broke trough off the upper boundary of descending channel. Bullish movement to resistance level at 2165 is expected to happen.

[ALTCOIN] ETCUSDT TREND LINE ANALYSISHello, everyone
We're a team that specializes in chart analysis
We will always analyze and provide you with charts to help you sell
There are so many trading laws and there are so many good technologies that come with them, but I'm confident that the trend line is really strong.
If you read the point of view and get to know the line, every line will adjust
Thank you.
------------------------------------------------------------------------------------------------
Chart Analysis Content -
As you can see from the chart, once the rise begins, moving at a high angle comes out.
It is going up along the yellow sharp upward trend, but if it breaks, it can check the green support line one more time and go up.
If you want to go up from your position now, you have to break through the downward trend of thick blue and rise above the upward trend of thick white.
If the decline continues, it will fall to the angle of the red downward trend.

ETC elliott waves #ETC/USDT
$ETC Elliott waves and descending parallel channel show this downtrend is going to end between $12 and $5.

ETC 30 - 40 % potential long setup !hi !
I hope you are doing well my friends.
.....
( bullish signs )
1. price tested the trend line
2. get close to 23 level support
3. RSI got oversold
4. Bullish hidden divergence/divergences
5. also volume is very low and there is no seller anymore.
the target is around 38 $ which is more than 30 % profit.
.....
this is how I would like to enter trade
4h chart
after breaking the trend and retest on it
.....
not financial advice !
please , share your ideas with me
I would like to see what do you think about any cryptocurrency <3
have a great day.

BTC UPDATE BTC has bounced again off the daily support trend line and now hopefully we can see a retest and breakout of 4 hr falling wedge.


ETC USDT DOWNTRENDThis is weekly chart for ETC.
Price is in a sharp decline for the last 6 weeks losing around %50 of its value.
But there is no sign for a bounce just yet when you check out MACD, RSI or BB.
If price cant break 29.27 resistance level, we will go back down to 24.51 area which is a significant support area.
24.51 - important support
If we cant hold it 24.51 as a bottom in the weekly chart, we will experience a sharp decline.
Targets are as follows,
20.52
18.56
16.27
14.63
12.77
11.54 being the strongest one and will be a good accumulation zone if price ever get there.
ETC is one the altcoins that pumped hard a year ago.
It is a high volume coin which investors can trade on any major platform.
Therefore investors can buy and hodl for the long term. But buy price important. Right now investors should wait before making any risky decisions.
Thanks.
Follow for more charts, ideas and global economy reviews.

Ethereum Classic | ETC Falling Wedge Indicating Potential For GrEthereum Classic ETC is looking really good on the daily timeframe.
Let's focus on the obvious: We have the classic falling wedge pattern, which eventually will be broken. Now I like the spot ETC is currently in. We have these two supporting trendlines, at which we could see some volume flowing back into ETC.
I'm short-term bearish as I expect ETC to dip below $30 and in a worst case scenario find support around $25-27.5.
Once the price breaks through the upside of the falling wedge, we can position ourselves to take a long trade towards > $40.
Let's see how this plays out.
Thanks for your support.
Have a good one.

ETC Analysis (for practice) The yellow lines here are the daily unchecked levels I identified. Price seems to be making its way down to check the 28.75 level, with some stops along the way (Stops being unchecked levels within the lower timeframes).
The tan lines indicate 4-hour unchecked levels, one of which the price has recently checked (tan dotted line).
If there aren't many institute buy orders here at the 4hr levels, we shall see the daily level get checked soon, imo.
* This is not financial advice*

BTC UPDATEPrevious BTC chart daily using closed candles now changed to wicks shows this could be a new bottom and see a bounce from $38k level, a lower low will be very bearish however.


ETC/USDT : Moving into a falling wedge BINANCE:ETCUSDT
Hello everyone 😃
Before we start to discuss, I'll be so glad if you share your opinion on this post's comment section and hit the like button if you enjoyed it !
$ETC's moving into falling wedge and now it's getting supported by the local bullish order-block at $36.
The main movement's prediction is bullish; But as $BTC is getting the weekly close below $42000, It's better to have the possibilities for both side...
- Bullish Case; If we get the break-out above falling wedge, I'll locate my Long on a proper retest of higher order-block at $39, Then aim for $40.90 - $44.90 - $49.90
- Bearish Case; If we get the rejection below falling wedge, I'll locate my Short on a proper retest of mentioned order-block at $36, Then aim for $31's S/R zone/line.
Hope you enjoyed the content I created, You can support us with your likes and comments !
Attention: this isn't financial advice we are just trying to help people on their own vision.
Have a good day!
@Helical_Trades

ETC USDTGiven that ETC is located in a price channel between two heavy resistance ranges, we have to wait to see which direction it fluctuates.


Falling Wedge on ETCUSDTBased on technical factors ( Falling Wedge ) there is a long position in :
📊 ETCUSDT Ethereum Classic
🔵 Long Now 37.10
🧯 Stop loss 34.20
🏹 Target 1 45.30
🏹 Target 2 51.80
🏹 Target 3 62.30
💸Capital : 1%
We hope it is profitable for you ❤️
Please support our activity with your likes👍 and comments📝

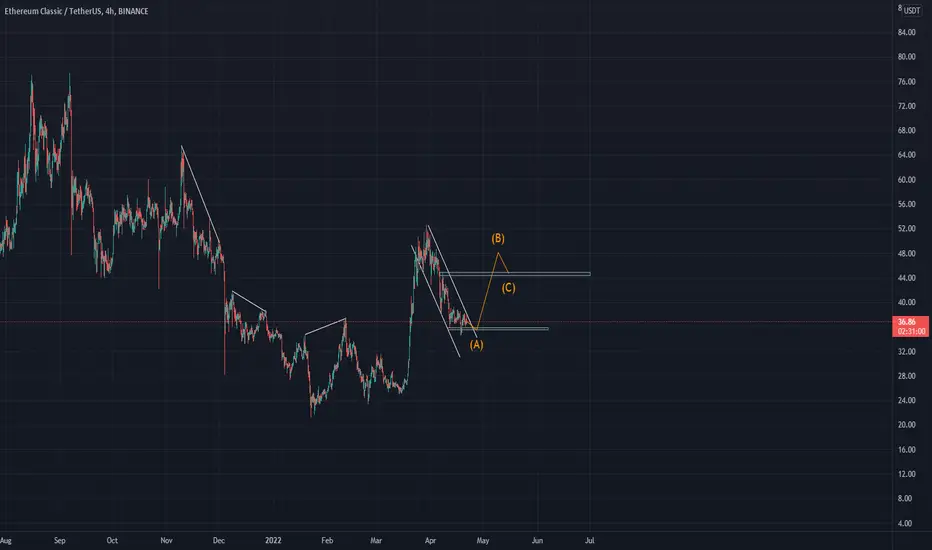
ETCUSDT- Falling Wedge PatternETCUSDT- (4h Chart) Technical analysis
ETCUSDT- (4h Chart) Currently trading at $37.25
Buy level: Above $38
Stop loss: Below $34
Target 1: $39
Target 2: $43
Target 3: $48
Target 4: $52
Max Leverage 3x
Always keep Stop loss
Follow Our Tradingview Account for More Technical Analysis Updates, | Like, Share and Comment Your thoughts
