ETHEREUM CLASSIC: SOON READY FOR A 100% MOVE!!Hello everyone, if you like the idea, do not forget to support with a like and follow.
Welcome to this ETC/USDT TRADE setup. ETC looks good here.
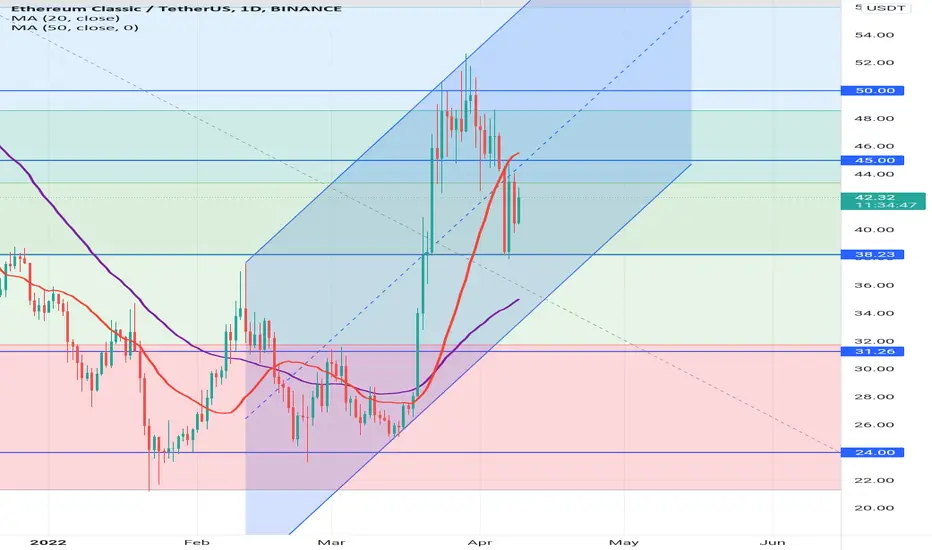
Ethereum classic is moving inside a bull flag kind of pattern where the breakout is still pending. But looks like it's breaking out soon. After the breakout, I'm expecting a 100% pump in ETC. So buy some now and add more in dips.
Entry range:- $36.5-$37.5
Target1:- $44
Target2:- $51
Target3:- $62
Target4:- $74
SL:- $33
If you like this idea then do support it with like and follow.
Also, share your views in the comment section.
Thank You!
Etc

ETC Ether Classic Bull Flag? Ether Classic (ETC) could be ready to go. If Bitcoin continues to trade sideways or push higher, I expect ETC to break to the upside. ETC has a lot of potential with the coming POS transition on Ethereum in which there shall be an exodus of miners. Some may argue this is the very reason that ETC exists, because of the changes coming to ETH. In the end both of these are run by individuals so neither has the shine for me that Bitcoin does, but regardless... Let's see!

ETC IS PRESENTLY AT FIB50. ETC at $43 and happen to be FIB50. This is an important level. If we breakout from this resistance, we should expect a rally to $50 zone.
What do we expect to happen next?


Analysis: ETC(Ethereum Classic) is at an Interesting Point Ethereum Classic performed a 2x move last month. After a while of a downtrend, ETC is now consolidating. What makes this coin "at an interesting point"? Let's look at the 4H chart and see what we have.
1. Recent RSI Bullish Divergence,
2. 0.618 Fib support
3. consolidation between 0.618 and 0.5 Fib
4. Falling wedge pattern(usually bullish)
While there are bullish signs, there are bearish signs, which are
1. 0.5 Fib resistance
2. Upper channel resistance
3. Price below 4h EMA 100
4. RSI 50.0 Resistance
Forecast
Price can either go to $30(0.786 Fib support) or beyond $50. It may go down if the falling wedge and 0.618 Fib breaks to the downside. It may go up once the upper channel, EMA100, and 0.5 Fib breaks to the upside. Will update this post as time passes.
As an extra here are things to watch out for
1. Upper Channel breakout
2. RSI crossing 50(or 70 for a strong move). 50 is an RSI resistance
3. 4h EMA100 breakout
4. Bitcoin(maybe Ethereum) Prices, may influence the prices of ETC
5. Wedge breakout either way(white transparent background)
6. 0.5 or 0.618 breakout(consolidation area)
Thanks for reading this post, stay tuned for my next analysis! Also, if you are willing to, please give feedback in the comments, thanks in advance.

ETC - Long#ETC
#ETCUSDT
Possible Harmonic Pattern
Current Price : 30.02
Target : 57.32
Activation Point : Crossing up 37.71
Stop Loss : 23.51
Good Luck

ETHUSD Looks like we are starting a consolidation stage. The price uptrend might be coming soon.
My position may be neutral for now.

ETC going 35 or below?Weekly timeframe looking bearish and shows hidden bearish divergence, would it reach 35 or even below?
===================
Divergence is when the price of an asset is moving in the opposite direction of a technical indicator, such as an oscillator, or is moving contrary to other data. Divergence warns that the current price trend may be weakening, and in some cases may lead to the price changing direction.
Divergence signals tend to be more accurate on the longer time frames. You get fewer false signals. Divergences on shorter time frames will occur more frequently but are less reliable.
READ THIS NOTE!!
Market can do anything specially on crypto, because of Bitcoin, investors often consider Bitcoin as the reserve currency of the cryptocurrency market, similar to the USD in the global stock markets. When bitcoin (BTC), the largest cryptocurrency by market cap, goes up, other digital tokens tend to increase in value as well. When BTC declines, it's likely that other players in the space will drop at the same time.


ETC gain 100% SOONETC after break-out descending channel, build Flag pattern.
In next few day, It starts new rally and gains almost 100%.

Ethereum Classic Potential BART - the next WAVES?Ethereum Classic / BTC 1D chart is showing a breakout in price, but with very low volume compared to April last year.
Price is currently quite high, and as you can see on the ETC/USDT 1 hour chart, buying volume has been falling and falling.
In the last few hours, we have seen selling increasing a lot.
You can also see the red volume falling underneath and retesting the Blue trendline on the Volume Oscillator, indicating a potential downwards move. What this basically means is that the buyers volume was rejected at a certain point and the sellers are taking control.
We also see a bearish Head & Shoulders pattern form on the 1 hour UNDERNEATH the Blue moving average price trendline, inside of a bear flag.
We could see a MASSIVE drop here - the chart is quite similar to WAVES - we are seeing distribution here at high levels after a low volume pump.
So why do I say BART?
Take a look on the 1 hour chart on the right. Look at the Volume oscillator. Do you see how price is rising but Volume is going lower? (See thick red resistance lines drawn.) This is bearish divergence in volume and detects MID TERM DISTRIBUTION.
Resistance is at 46.4 on Kucoin, or you can breakout trade. Good luck.

long ETCUSDTLong opportunity on ETCUSDT with leverage X5-X10.
Entry: 46.500 - 46.700
Target 1: 49
Target 2: 52
Target 3: 54
Target 4: 56
STOP LOSS: 42.500


VRusdt came and take to me to the moon 🌙🌙🌙🌙 3xVRusdt came and take to me to the moon 🌙🌙🌙🌙 3x
Middle target 🎯🎯🎯🎯 3x
Let's be a rich

Ethereum Classic not as Ethereum Modern
Ethereum Classic is a decentralized computing platform that executes smart contracts. Applications are ran exactly as programmed without the possibility of censorship, downtime, or third-party interference.
Ethereum Classic is a distributed network consisting of a blockchain ledger, native cryptocurrency (ETC) and robust ecosystem of on-chain applications and services.
Rank #29
Coin
On 282,810 watchlists
Ethereum Classic Price (ETC)
$55.98
1.05%
0.0008644 BTC0.48%
0.01207 ETH1.07%

ETC Ethereum Classic: 1M Chart ReviewHello friends, today you can review the technical analysis idea on a 1M linear scale chart for Ethereum Classic (ETCUSD).
Ethereum Classic price on a monthly chart shows multiple areas of resistance. Price has a chance to move back down with the Fibonacci Retracement levels shown along with 200 SMA and RSI.
If you enjoy my ideas, feel free to like it and drop in a comment. I love reading your comments below.
Disclosure: This is just my opinion and not any type of financial advice. I enjoy charting and discussing technical analysis . Don't trade based on my advice. Do your own research! #cryptopickk

ETC Ethereum Classic to the moon! 🌝 100.00 + usdMy prediction for Ethereum Classic is a whopping top out price 100.00 + usd. Once it breaks the 40.00 usd resistance level it should appreciate and double it’s value. As you can see it has gotten out of the bottom and is now bullish holding above 13.00 usd. The price should start spiking up and make a quick double top before a small sell off, then it’s off to appreciation. This is my idea! If you take a chance and risk it, the reward may be huge. Invest and trade at your own risk, research, and beliefs. This is not advice.
Good luck everyone.

Just a "classic" Ethereum (ETC) bull flag chartHey everyone,
Nothing special here, maybe a little as I just wanted to share that view on ETC and usually its Ethereum not the "classic" one, because it looks like very nice bull flag with break out and retest played out & it feels to me like a very nice R:R entry.
but there is something furthermore going on behind with ETH & ETC in next months, so I would pay attention to ETC this year.
Trade safe and keep your mind focused
Cheers
ChaChain
-------------
Disclaimer:
I´m not registered or licensed in any jurisdiction whatsoever to provide investing advice or anything of an advisory or consultancy nature, and therefore I´m unqualified to give investment recommendations. Always do your own research and consult with a licensed investment professional before investing. This communication is never to be used as the basis of making investment decisions, and it is for entertainment purposes only.
KEYWORDS
R:R, money management, risk, reward, technique, style, trading, bitcoin , bitcointrading, profitable trading, profittrading, profit trading, secret, divergence, bull divergence, bear divergence, divergencetrading, divergence trading, trading strategy, how to trade bitcoin , bitcoin trades, bitcoin trading, make profit, take profit, trading strategy, trading technique, successful, successful trader, successful technique, successful strategy, successful secret, how to trade, trend analysis, technical analysis , indicators, rsi , relative strenght index, let it rain, successful life, easy strategy, easy trading, easy technique, make money, crypto investing, investing, crypto, cryptocurrency, cryptocurrencies, mentoring, money, chartart, beyond technical analysis

ETC TECHNICAL ANALYSIS (Ethereum classic) ETC graph technical analysis, please give me feedback or any criticism that you may have on my analysis that would be greatly appreciated and feel free to comment anything that will also be very appreciated!!!

ETC/USDTesting/tracking elliot wave theory. Please do not trade off idea without S/L. Not financial advice.
Link to previous chart:
Wave 4 retracement has bottomed out I think. It went further down than what I had counted on the previous chart. We should be working towards the last impulse wave (5).
wave 5 top: $200-250

LUNAUSDT %45 VIP MEMBERS 🎯🎯🎯 LET'S SEE THE WINERLuna new ath coming soon 🔜🔜🔜
This is our VIP members target 🎯🎯🎯
%45 profit, up your stop's
Let's make money 💸💰💸💰💸💰💸

AlphaUsdt old target 🎯🎯🎯 reactive, %200 coming soon Alpha USDT has big volume ,last two days it's have big entries so old targets re active now.
Firstly %30
Second%40
Third %30
Fourth %50
