ETC/USDT - Potential 293% SetpHello Traders!
ETC continues to move in a downtrend, completing the previous business cycle.
The price range of $11.30 - $14.50, from which the acceleration of upward movement began in the spring of 2021, will be a comfortable zone for formation of a medium-term position.
It will be necessary to close the position by stop-loss only in case of decrease of the price under the support level of $7.28.
It will be a good opportunity to fix profit on such deal within the price range of $29.00 - $44.50
Good luck and watch out for the market
P.S. This is an educational analysis that shall not be considered financial advice
Etc

RRTUSD running $RRTUSD THIS COIN WENT OFFFFFFFFFFFF if it can hold this level it can really do something

🔻 ETC FALLING DOWN TO THE HELL🔻Hello investors and traders.
briefly open a short position if the daily candle closes below the EMA.
Disclaimer: this is not a piece of financial advice always do your own research.

🆓Ethereum Classic (ETC) Feb-16 #ETC $ETC
ETC is under strong selling pressure after rising sharply from the $22 zone to the $36 zone and in the next few days it could correct to the $28 zone to retest this zone before continuing to move up to the $40 zone.
📈RED PLAN
♻️Condition : If 1-Day closes ABOVE 28$ zone
🔴Buy : 28
🔴Sell : 34 - 40
📉BLUE PLAN
♻️Condition : If 1-Day closes BELOW 28$ zone
🔵Sell : 28
🔵Buy : 24
❓Details
🚫Stoploss for Long : 10%
🚫Stoploss for Short : 5%
📈Red Arrow : Main Direction as RED PLAN
📉Blue Arrow : Back-Up Direction as BLUE PLAN
🟩Green zone : Support zone as BUY section
🟥Red zone : Resistance zone as SELL section


ETC- Trend update (LONG)Hello trading friends,
This is a daily update for ETC with the trend expected for a long.
ETC looks to have a stable trend since the breakdown.
Grayscale owns this coin also depending on the dollar cost average - and it shows that it has the possibility of growing in the coming time.
It's always good to wait for confirmations and to buy into the red.
Interesting levels for uptrend are 46 USD, and 53 USD trend further also the important 64 USD level for long term.
Let's see how this coin will affect the coming time, and or it will get a breakout.
Most of the coins waiting for BTC - so it's important also to follow BTC trends - and price changes take also time.
At all times manage your risk well and have a great day.
If you like this idea - leave a like and follow - Thank you
This is not a trading call.

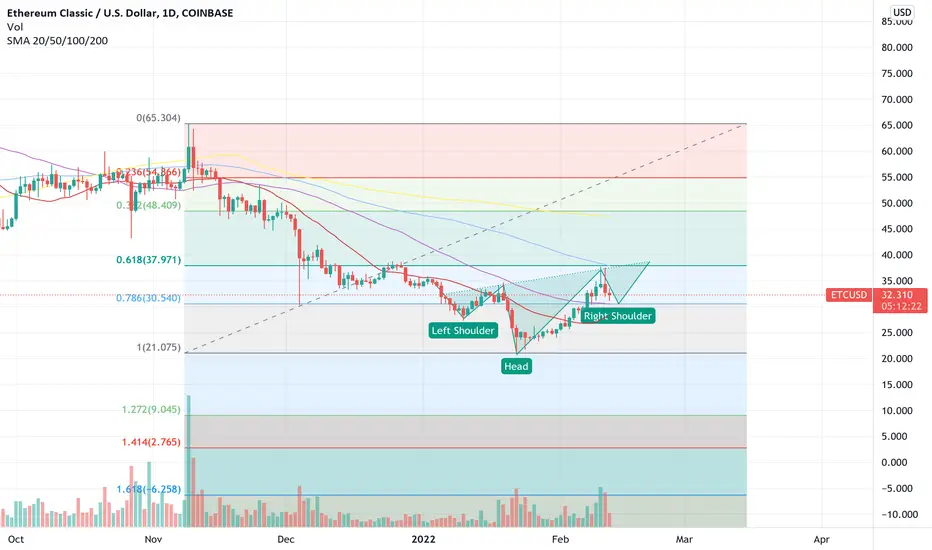
inverted head and shoulders?am not a financial advisor.
ether Classicoutperformed many Alts in 2021 possible to do the same in 2022 and reach 170 dollars again or more.
please take a look at bitcoin. we are not in a bear market yet. Elliot wave of 12345 is not yet finished in bitcoin.
once inflations calms down. we will see a reversal.
btc might hit 40.8- 41 which is the cme gap
but before that happens. we may get a chance to grab some at 30.52 which is the 50ma.
I have my buying order set already
happy trading and happy profit taking

Short Trading Signal For ETC! Time to end this :)Trading Signal:
There is a Trading Signal to Short in ETH/USDT
Traders can open their short trades NOW
Bearlish Bat Pattern:
Bearlish 113 bat Short Signal
Entry:36.40
Stoploss:38.50
tp1:31.50
tp2:27.80
What are these signals based on?
Harmony Pattern Technical Analysis & RSI
If you liked MY ideas, please support me with your likes 👍 and comments.


$ETC/USDT 3h (#BinanceFutures) Descending trendline breakoutEthereum Classic just regained 100EMA support and looks good for bullish continuation.
ethereumclassic.org
Current Price= 32.650
Buy Entry= 32.535 - 31.579
Take Profit= 34.826 | 37.111 | 40.293
Stop Loss= 29.745
Risk/Reward= 1:1.2 | 1:2.19 | 1:3.56
Expected Profit= +25.92% | +47.31% | +77.07%
Possible Loss= -21.63%
Fib. Retracement= 0.702 | 0.883 | 1.117
Margin Leverage= 3x
Estimated Gain-time= 3 weeks
Contracts:
#Mainnet
#BEP20 0x3d6545b08693dae087e957cb1180ee38b9e3c25e
#BEP2 ETC-758

ETC BTC Bullish divergence TP2 (TP1 would be around 0.0012)ETC BTC Bullish divergence TP2 (TP1 would be around 0.0012)

ETCUSDT TECHNICAL ANALYSISAre you ready to earn approximately 30%? ETC hasn't reached last ATH since May 2021. The candles are break out down trend-line and one of the candle open-close completely above down trend-line. Then we have got BUY 2 signal from @EngineeringRobo . This mean we already have 2 opportunities for BUY. Also MA Cross strategies changed to direction as well. It is another BUY signal too. Not only that, Risk/Reward Ratio 1 and get.ready for earn 30%. Next target might be $38.
"NFA"


Simple but smartHi guys
The triangle is broken upwards. It is expected that the price will increase to the ceiling after the failure of the midline. Of course, the target will be updated according to the bitcoin trend
What do you think?
If you have any questions, I will be happy to answer
If you like this analysis, like and follow 🙏
Do not pay attention to shadows
This analysis (to determine profit margins) is updated here 🔄
This analysis is a personal analysis and not a buy and sell signal, so it is the responsibility of the person to buy or sell
Also, if you have a suggestion or criticism, we will be happy to hear it
Look at our past analysis to trust us

Etc bullish !!!ETC went over the down trend .... and made the pullback action .... its an opportunity to get hudge incomes !

ETC to 44 USDHello,
Ethereum classic broked out this falling wedge and now a good movement will happen.
A close above 0.000750 sats in 7 hours will put ETC into a nice uptrend zone because will get the MA support.
Stochastic/RSI bullish divergence
ETCUSDT broked out the downtrend, now we need a re-test and after FLY baby
Have fun guys! The target you can see in chart

ETC 2022It seems to look like we have some awesome moves this year to the new level of crypto value.

ETCEthereum Classic is one that we hear less about. But its chart on the 3D looks very good.
✅ MACD bullish cross
✅ Stochastic RSI went oversold and then bullish cross
✅ Bouncing from support
✅ Broke out of the diagonal
✅ High volume on the lower (4H) TF
Entry: $30.7 to $32 or on the first pullback
SL: $29
TPs: $36.94, $56, $76, $134

Simple but smartHi guys
Long-term channel failure descending and being pullback to the broken channel
It can be a good option for review
Do not pay attention to shadows
what is your opinion?
Please like and follow if you like

ETC - Long-Term and Short-Term Plan!Hello everyone, if you like the idea, do not forget to support with a like and follow.
ETC is approaching a strong support zone 25-30 in green so we will be looking for buy setups.
Long-Term: right
on DAILY, ETC is forming a channel in blue but the upper trendline is not valid yet, so we are waiting for a new swing high to form around it to consider it our trigger swing. (projection in purple)
Since ETC is sitting around the lower blue trendline and support, we will also be looking for buy setups on lower timeframes.
Short-Term: left
on H4, ETC is forming a trendline in red but it is not valid yet, so we are waiting for a new swing high to form around it to consider it our trigger swing. (projection in purple)
Trigger => Waiting for that swing to form and then buy after a momentum candle close above it (gray zone)
Meanwhile, until the buy is activated, ETC would be overall bearish can still trade lower.
Good luck!
All Strategies Are Good; If Managed Properly!
~Rich

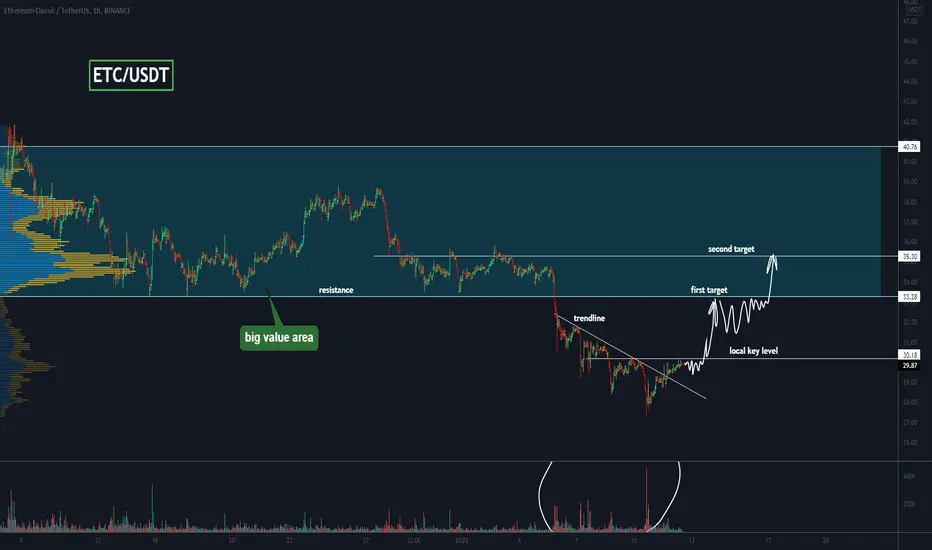
ETC, price squeezes near a key level The ETC has long been in the $40-$33 range. But the price was never able to hold and corrected below this range.
A trend line and a key level can now be identified locally. The price broke through the trend line and is squeezing near the key level. In a breakout of the key level, there could be a good buying opportunity. Also with every decline, there was a volume at the bottom, this is a positive signal.
Write in the comments all your questions and instruments analysis of which you want to see.
Friends, push the like button, write a comment, and share with your mates - that would be the best THANK YOU.
P.S. I personally will open entry if the price will show it according to my strategy.
Always make your analysis before a trade.