ETC Is looking Bullish!The price bounced from the mid line of the ascending channel and it is now showing signs the momentum to the upside is not over.
Etc

ETC BOTTOM TRIANGLE 20% Ethereum Classic $ETC forming a base triangle showing heavy accumulation within the range
Buy $57.8 - $59.5 and take profit at 72$-76$
This should be a quick trade hopefully the pattern resolves by weekend
Goodluck!!

ETCUDSTAs it is shown on the chart, Ethereum Classic can touch the upper levels. Be committed to the chart and the mentioned prices. Whenever you are in profit, you can take your profit. Enjoy!

ETH/ETC MASSIVE OPPORTUNITYThe lag and catchup of ETC has to be one of the most consistent correlations in crypto. The R/R on ETC right now could be monstrous.


Ethereum Classic (ETC)Hi everyone,
This is my description:
Purple Lines: Support & Resistance (for a week) “VERY IMPORTANT”
Blue Lines: Support & Resistance (for a day) “IMPORTANT”
Orange Lines: Support & Resistance (for a 4H)
Thanks for your attention.
**IF YOU WANT ME TO ANALLYSIS ANY OTHER CRYPTOS, PLEASE COMMENT THE NAME OF IT FOR ME**

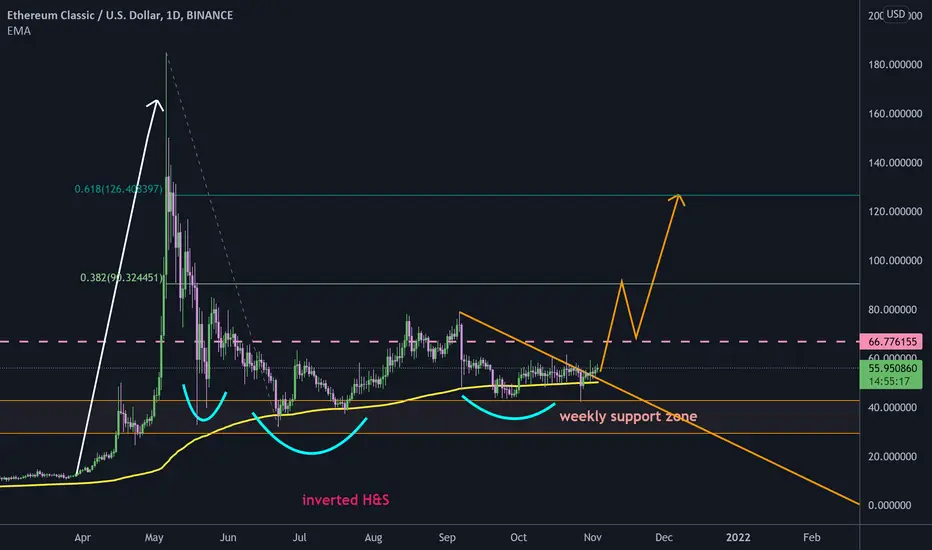
ETC inverted head and shoulders to $125#ETCUSD
$ETC broke out from descending resistance line and confirmed it as support, also price stayed above weekly support zone.
an inverted head and shoulders pattern shows that price can reach $125.
#ETC didn't increase during #ETH rise so it's time to show its potential.
break below weekly support will make this scenario invalid.
🔥 ETC / USD — Ethereum Classic Trading 🔥 x8!!!Hey awesome person!
Seems like this little ETC will come the the new ATH, if this accumulation gain enough strength!
Current price support at $50-46 zone. I think to have additional entry there.
Initial target within the range of 75-60, with rebuy at 58-55.
Mid term target will be at 80-ish up to 110.
Long term holding up to 200-400 by the end of 2021, early 2022.
If you will follow this trade, please, consider use affordable risk.
Best regards
Artem Shevelev

ETC ANALYSISEtc consolidating in a box pattern 51.7 -57.68$ and having a support of box bottom.
(BUY 1 and BUY 2 ) I can see good buying zone if market taken sudden action .
Those who play futures and buy sell according to fib and box pattern
For mid term , targets are - 65.87 , 77.45 ,98.92 $
ENJOY YOUR DAY

ETC 1D analysisHello to all
I am at your service with 1D ETC/USDT analysis
best entry point
after fixity top of MA200 ( top of 57.18)
Targets ( Around ):
1) 61.23$
2) 64.30$
3) 73.95$
4) 85$
Supports ( Around ):
1) 44.2$
2) 33.6$
notice : MACD, Rsi and Mfi are suitable area also daily downward trendline is breaked.

Ethereum Classic (ETC)Hi everyone,
This is my description:
Purple Lines: Support & Resistance (for a week) “VERY IMPORTANT”
Blue Lines: Support & Resistance (for a day) “IMPORTANT”
Orange Lines: Support & Resistance (for a 4H)
Thanks for your attention.
**IF YOU WANT ME TO ANALLYSIS ANY OTHER CRYPTOS, PLEASE COMMENT THE NAME OF IT FOR ME**

ETC (Ethereum Classic) 200% plus targetHello Traders,
This analysis is on Ethereum Classic, a hard fork from ETH. This has been a coin that has risen in price quickly as it is one of the few cryptocurrency's listed on Robinhood. That being said, we are currently breaking out of a Symmetrical triangle that has been in consolidation for multiple months. This is very bullish as we are on the cusp of one of the most massive bull run man kind has yet to experience. Please leave a comment and tell us what you think. Or stop by Crypto Kinfolk on FB and join our community.
As always, Have a green week,
Savvy
ETC Price Live Data
The live Ethereum Classic price today is $55.28 USD with a 24-hour trading volume of $1,425,042,812 USD. We update our ETC to USD price in real-time. Ethereum Classic is up 4.19% in the last 24 hours. The current CoinMarketCap ranking is #29, with a live market cap of $7,217,831,719 USD. It has a circulating supply of 130,565,479 ETC coins and a max. supply of 210,700,000 ETC coins.
If you would like to know where to buy Ethereum Classic, the top exchanges for trading in Ethereum Classic are currently Binance, Mandala Exchange, CoinTiger, OKEx, and Upbit. You can find others listed on our crypto exchanges page.
What Is Ethereum Classic (ETC)?
Ethereum Classic (ETC) is a hard fork of Ethereum (ETH) that launched in July 2016. Its main function is as a smart contract network, with the ability to host and support decentralized applications (DApps). Its native token is ETC.
Since its launch, Ethereum Classic has sought to differentiate itself from Ethereum, with the two networks’ technical roadmap diverging further and further from each other with time.
Ethereum Classic first set out to preserve the integrity of the existing Ethereum blockchain after a major hacking event led to the theft of 3.6 million ETH.
Who Are the Founders of Ethereum Classic?
Ethereum Classic is in fact the legacy chain of Ethereum, and its true creators are therefore the original Ethereum developers — Vitalik Buterin and Gavin Wood.
A contentious hard fork on Ethereum occurred in July 2016, when participants disagreed over whether to revert the blockchain to cancel out the effects of a major hack. This impacted The DAO, a decentralized autonomous organization (DAO) which had raised approximately $150 million in an initial coin offering (ICO) several months earlier.
Ethereum Classic came into being as the network which did not revert the chain. Developers state that there is no “official” team attached to the project, and that its “global development community is a permissionless 'do-ocracy,' where anyone can participate.”
What Makes Ethereum Classic Unique?
Ethereum Classic’s main aim is to preserve the Ethereum blockchain as it originally was, without artificially countering the DAO hack.
Its appeal was first to those who disagreed with Ethereum’s response, but the legacy network has since gained a wider fan base, which include major investors such as Barry Silbert, CEO of investment firm Grayscale.
As a voluntary organization, the developers of ETC do not aim to turn the network into a for-profit entity. Users pay transaction fees as with Ethereum, and miners collect them based on work done as per the proof-of-work (PoW) mining algorithm.
Unlike Ethereum, Ethereum Classic has no plans to convert to a proof-of-stake (PoS) mining algorithm, while multiple developers continue to work on future improvements such as scaling solutions.
Related Pages:
Read more about Ethereum here.
Read more about Bitcoin Cash here.
New to cryptocurrency? Find all the information you need with Alexandria, CoinMarketCap’s dedicated education resource.
How Many Ethereum Classic (ETC) Coins Are There In Circulation?
ETC began in a very similar technical state to ETH, with the exception of how the DAO hack transactions were handled.
Since launch, however, changes in tokenomics have occurred, with participants voting to cap the supply of ETC in December 2017. The maximum supply is thus 210,700,000 ETC, roughly ten times that of Bitcoin (BTC), while ETH has no cap.
ETC uses a PoW mining algorithm, which functions like Bitcoin — miners are rewarded with new coins for validating the blockchain in competition with each other. The ETC block reward decreases with time, with the next drop due at block 15,000,000, roughly in April 2022 — from 3.2 ETC to 2.56 ETC per block.
How Is the Ethereum Classic Network Secured?
The Ethereum Classic network is secured using proof-of-work, but as a minority chain, it has suffered regular attacks itself.
These include several 51% attacks to gain control of mining hashrate and execute spurious transactions and double spend coins, the most recent of which occurred in August 2020.
Where Can You Buy Ethereum Classic (ETC)?
ETC is a major market cap cryptocurrency and is freely tradable on a large number of major exchanges.
Pairs are available against stablecoins, other cryptocurrencies and fiat currencies, while derivatives and institutional investment vehicles also exist. Exchanges that let you buy Ethereum Classic include Binance, OKEx and Huobi Global.

ETC uptrend as I see itETC has been fairly quiet since it's last rally but it's been in a channel and near some long supports. The weekly RSI has a clear level for resistance/support which I've circled. You can see where it's bounced and failed. It currently appears as if it's bounced and looking to rehold.
if it does, I'm thinking a bounce to the top of the channel, retest of the long term support. If that long term support holds, 2021 could see it move.

Not to the moon, just to the midline...#ETC
1. On the floor of the ascending channel with the aim of the midline and the ceiling of the channel
2. Flag pattern is created
+ in my watchlist

ETC is going down to $42Good shorting opportunity with good risk/reward per trade.
ETC is very weak and there must be dropdown

ETC (Ethereum Classic), wait for the price to get out of range !hey yall ,
so as yall see , ETC is repeating the last pattern . if you look at the pattern , you'll see that price started huge elliott waves after getting out of range . then we had ABC correction waves . NOW , time for what ?
in my opinion , the best time to buy is when the price got outta range . why ? I'm saying that due to our last pattern . what are the targets ? first target is ATH , after reaching it , I'll keep yall updated on that .
after breaking above the channel , huge waves will be expected . if you put ETH and ETC charts near each other , you'll see that ETC always starts to rise few months after ETH , but with a faster pace . so don't worry about ETC being neutral now while other coins are reaching their ATHs .
so I guess let's just wait !
Ethereum Classic surely has a bright future !
if you liked the idea , give it a like .
and if you wanna see more of these , follow , heck of analysis are on the way !
also tell me your opinions on this idea in the comments .
Good luck .

Etc usdt verge of break out Look for a short term long buy on etc usdt
It will soon break out
I just predicted the shib break out! So pay attention

Eth Classic charging towards $62.39 before Tuesday.BITFINEX:ETCUSD Looks to be in very healthy shape to make a move up towards the $62usd level within the next few days. We appear to have come down and tested resistance on the daily (yellow) and have also bounced off of the diverging RSI trending (green) towards our upwards target. In order to maintain momentum and reach the goal we will need to open above $54.498 & $55.583 over the next two days (blue lines).
Overall price trend is currently on an upward trajectory.
RSI appears to be in a healthy position where it has come back down towards the 0.5 line and has bounced up showing bullish momentum. It is also above the sma8 on the daily RSI which confirms a bullish RSI trend.
The $60 area could prove as tough resistance as we enter and try to punch through. Keep an eye out here for a possible double top to occur and send the price level back down towards the bottom of the arc.
* This Content is for informational purposes only. You should not construe any such information or other material as investment, financial, or other advice.

ETC/USD - Potential +235% investment setupHello Traders!
The last ETC business cycle is over and the first phase of the new one has begun.
Consolidation is followed by growth, on which we will be able to fix our medium-term purchases.
The position can be taken in the range of $44.75 - $59.32.
Stop-loss in case of a significant correction of the asset is better to be placed under the level of $29.00
The targets for midterm purchases will be price levels of
$104,68
$129,70
$150,00
Good luck and watch out for the market
P.S. This is an educational analysis that shall not be considered financial advice

ETC BREAKING OUT (NEW ATH SOON)ETC breakout will be historical, buy and Hold
ETC is breaking out on daily timeframe

ETC ETCUAS ETHEREUM CLASSICETC ETCUAS ETHEREUM CLASSIC
ETC ETCUAS ETHEREUM CLASSIC
ETC ETCUAS ETHEREUM CLASSIC
ETC ETCUAS ETHEREUM CLASSIC
ETC ETCUAS ETHEREUM CLASSIC
Bow tie diametric
Bow tie diametric
Bow tie diametric
Bow tie diametric
Bow tie diametric

ETCUSDT bull signETCUSDT Given the positive reactions to the MA200, as well as being in wedge and RSI reactions, it seems that in the bull market, can climb to the previous ATH after breaking its dynamic resistance.

ETC/ETH falling wedge#ETCETH
#ETH with ETH pair made a falling wedge pattern, that price needs to close inside and above the lower line for now, otherwise if going to close below the lower line of this wedge the fractal can lead price to zero 🤭👀. but holding the support zone and a break out from falling wedge can head up price to resistance zone around 0.022 ETH.
