ETCUSD

Ethereum Classic (ETC) - April 11Hello?
Dear traders, nice to meet you.
By "following" you can always get new information quickly.
Please also ask for the "Like" clock.
Have a good day.
----------------------------------
The volatility around April 12th (April 11th-13th) will have to see if there is any movement that deviates from the 16.5310793-22.9095781 range.
In particular, we have to see if we can get support in the 19.7203287-20.7834118 range.
You should watch for movement to touch the critical point, point 26.2054400.
If you decline at 16.3195170, you need a short stop loss.
-------------------------------------
(ETCBTC 1W chart)
(1D chart)
We have to see if we can get support and climb in the 3070 Satoshi-3541 Satoshi section.
If it is supported by the 3070 Satoshi branch, it is expected to continue the upward trend.
-------------------------------------------------- -------------------------------------------
** All indicators are lagging indicators.
So, it's important to be aware that the indicator moves accordingly with the movement of price and volume.
Just for the sake of convenience, we are talking upside down for interpretation of the indicators.
** The wRSI_SR indicator is an indicator created by adding settings and options from the existing Stochastic RSI indicator.
Therefore, the interpretation is the same as the conventional stochastic RSI indicator. (K, D line -> R, S line)
** The OBV indicator was re-created by applying a formula to the DepthHouse Trading indicator, an indicator that oh92 disclosed. (Thank you for this.)
** Check support, resistance, and abbreviation points.
** Support or resistance is based on the closing price of the 1D chart.
** All explanations are for reference only and do not guarantee profit or loss on investment.
Explanation of abbreviations displayed on the chart
R: A point or section of resistance that requires a response to preserve profits
S-L: Stop Loss point or section
S: A point or segment that can be bought for profit generation as a support point or segment
(Short-term Stop Loss can be said to be a point where profits and losses can be preserved or additionally entered through installment transactions. It is a short-term investment perspective.
GAP refers to the difference in prices that occurred when the stock market, CME, and BAKKT exchanges were closed because they do not trade 24 hours a day.
G1: Closing price when closed
G2: Cigar at the time of opening
(Example) Gap (G1-G2)

ETC Long-term resistance broken!ETC has just smashed through a long-term diagonal resistance with high volume.
If price can hold above this is definitely one to watch.

Here I go long on Ethereum Classic and ETC will go upHere I go long on Ethereum Classic. The price is testing the major resistance, so now I go 5x long and the bullish breakout will start. See you up there.

ETC/USDT now 100% profit but still $50 potential#ETC/USDT Profit Update:-
$ETC currently trading at $18.30
So now almost 100% profit from our entry.
Entry 1:- $11.66 ✅
Entry2:- $9.4 ✅
Still our 1st Target not achieved but 100% profit from our entry.
Personally I am expecting $50 Target.
Support:- $15/$12
Resistance:- $21.3/$37/$62/$110
Please click LIKE button and Appreciate my hard work.
Must follow me for latest crypto real time updates.
Thank you.

ETC/BTC Now 53% up and still 200% potential #ETC/BTC Profit Update:-
#ETC currently trading at 3112 Satoshi
And Our entry was 2000 Satoshi
Now 53% up from our entry.
Ride just started many more Targets will come soon.
Entry:- 2050 Satoshi ✅
TP1:- 3028 Satoshi ✅
If Retracement come then best re entry would be around 2500-2600 Satoshi .
Please click LIKE button and Appreciate my hard work.
Must follow me for latest crypto real time updates.
Thank you.
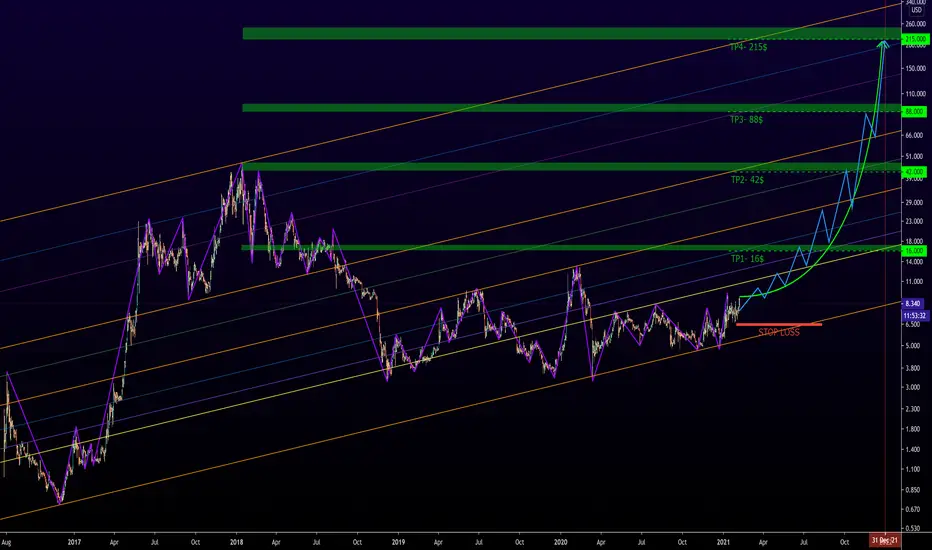
#ETHEREUMCLASSIC #ETC Possible targets for 2021ETHEREUMCLASSIC ETC Possible targets for 2021
TARGET1- 16$
TARGET2- 42$
TARGET3- 88$
TARGET4- 215$
STOP LOSS: UNDER 6$
Goals 3 and 4 are less likely to be achieved.
Upon reaching each new target, the previous target should be considered as a loss limit.

Etc to $50Etc is getting ready to go to $50.
If this weekly candle closes above 13.5 we will be breaking $20 by next week

Ethereum Classic / US DollarETCUSD
Buy!
Target 1 - $19
Target 2 - $26
Target 3 - $50
If you like the idea, do not forget to support with a like and follow.
Thank you and Good Luck!


ETC/USD - potenital 43% setupHello, Traders!
Statistically, April is a month of growth for cryptocurrencies, with assets coming off a correction to new price highs.
ETC, which has been consolidating within the $11.30 - $12.88 trading range for a long time, is also worth paying attention to.
Entering in the position can be searched during correction between $12.04 - $12.64.
Stop-loss can be set at $10.84
Targets will be price levels of
$14,24
$15,78
$17,33
Good luck and watch out for the market!
P.S. This analysis is created for educational purposes only and shall not be considered as the financial advice


ETC/USD - Where next? $14 or $10...As with most charts, the market is still trying to decide where to take us next and the same applies to ETC.
We are in a symmetrical triangle that is soon to break. Key levels are on the chart and it is important to wait for this formation to break before taking a position.
The indicator on daily are a bit flat and we need to break out to get confirmation on next steps. On 4H timeframe we seem to want to push higher, therefore if we break above this triangle then we may have sufficient confidence to consider a long, however, watch BTC. BTC and ETH are not that bullish and may keep the market bearish for some time, do check those charts linked below.
Like and follow if you liked this idea! Also join my crypto community to stay in touch!

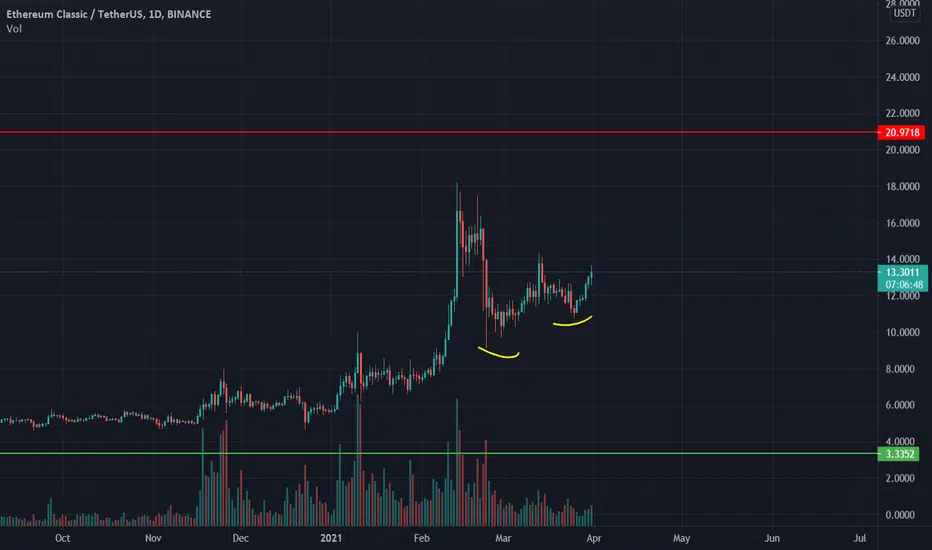
ETC/USDT TA Update ( bullish Technical View )#ETC/USDT TA Update:-
#ETC/USDT currently trading at $11.658
Support 1 is our 1st entry zone.
Entry 1:- $11.66
Entry 2:- $9.4
Targets:- $21.36/$37.4/$62/$110
There are two support level in chart.
Support 1 is $11.65 this is currently trading level.
If this break down then next entry will be $9.4
Please click LIKE button and Appreciate my hard work.
Must follow me for latest crypto real time updates.
Thank you.

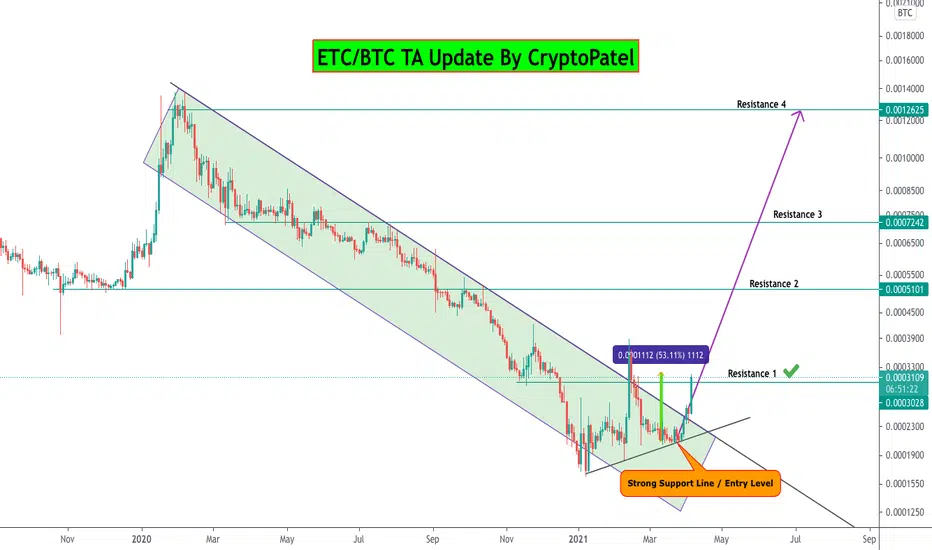
ETC/BTC 500% potential from here so what can we do..?#ETC/BTC TA Update :-
#ETC currently trading at $2150 Satoshi
And this level is very strong level and I can expect big bounce from here.
Black support line is very Important line.
Above this line very bullish #ETC/BTC
Entry:- 2050-2150 Satoshi
Targets:- 3028/5101/7242/12625 sat
Stop Loss:- No need for stop loss but still you want then if any daily candle close below 2000 Satoshi then you can exit but also remember again if any daily candle close above 2000 Satoshi then again enter.
I can expect 500% from here.
Please click LIKe button and Appreciate my hard work.
Must follow me for latest crypto real time updates.
Thank you.

ETC cycles in USD and BTC pairsOver the last several weeks there have been recurring cycles of inflow into ETC as both BTC and ETH continue to rise. This is to be expected with the USD pair, but the BTC pair has also experienced sensational inflow at times when BTC price action hesitates. There have been two instances of just a couple day's worth of time that provided opportunities to double a BTC investment by using the ETCBTC pair all while BTC continues its historic rise in terms of USD. The cycle currently appears to be approaching a third instance and I plan to watch closely. A brief wick downwards has preceded each ETCBTC spike and may provide a good opportunity for entry.

ETCETC looking almost the same as QTUM did before it broke that IH&S. I target 16$ for a short scalp. Could go higher.

ETC/USD ANALYSwe have strong resistance area above our price but we are in bullish channel if the price can break this area we can buy. and price is above MA100 yet.
we set our SL under channel.
good luck
please comment that waht is youre idea. breakout or reverse?

Ethereum Classic (ETC): All levels to watch!I made a simple cheatsheet for you, look to levels.
My Bias: Bearish
Basis:
4H MACD: Bearish
4H RSI: Bearish
EMA 12H: Opposite to price
Volume 1H: Decrease
Donate:
BTC: 1Gro97DoABk7BMegn5TKopmMXLKQefej9r
XRP: rw7wnYPy8ZR542piPUNcz8fzmkNZY27WXS
BNB: bnb1r2r3rzad7v0lkmhr4kn6wp5stsr7ur8gknvqp2
UNI: 0x112F395E94a7084Ca6dAa9Ba1462192Ac56570F5
USDT: 0x112F395E94a7084Ca6dAa9Ba1462192Ac56570F5


🔥Ethereum classic may fly again As you see in the pic if ETC keep its price above resistance line, price may rise to ATH and make a good profit
