ETC bullish scenario?Based on volumes and supports I am trying to imagine how possible ETC is going to evolve.
ETCUSDT

It looks like recovery timeHi there
How is it going? I hope you're having a healthy time sticking to your personally crafted trading directives.
It seems to me that the market is recovering, Are we going to see 100$ per ETC again? How about 55000 $ per BTC?
I'm looking forward to hearing from you 👍🌼

Ethereum Classic - ETCUSDHello Traders
Ethereum Classic recently undergone a pump-and-dump and is currently hanging on a thread by our last major support zone.
If we close a daily candle BELOW this zone, I expect more downward pressure.
Check out my related video analysis below,
Trade Safe
Evelyn

ETCUSDT broke down the middle line#ETCUSDT
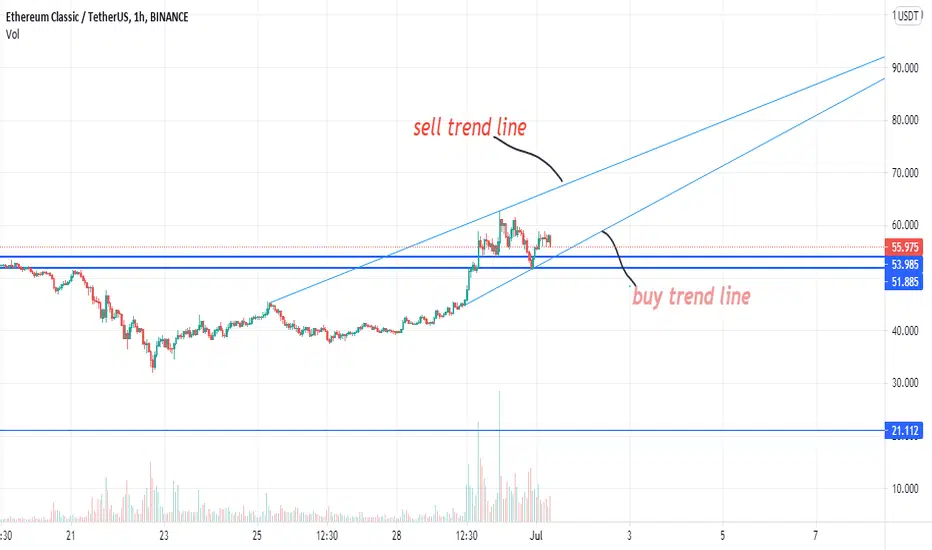
$ETC is trading inside a parallel channel, which can be a flag to continue the uptrend.
now price broke down the middle line and try to confirm it as resistance.
I expect $ETC drop to touch the lower line of parallel channel and fly again.

ETCUSDTHello to you all. Mars Signals team wishes you high profits at all times.
We are in a 4 hour time frame. We are fluctuating in an increasing triangle, we expect it to be able to touch its target over time after breaking the ceiling of the triangle, but if it comes out of the bottom of the triangle, there is a possibility of price correction.
Warning: This is just a suggestion to you and we do not guarantee profits.
Wish you luck!


ETCAt one o'clock I see that the classical atrium is in a symmetrical triangle
If it is broken on any side, it will be a trading opportunity
Important
Get help from volume to confirm

Update
The Most Powerful Elliott Wave is wave 3.
Wave 3 coming. Warm hugs for ETC!
BTC is in Bullish (see attached idea).
Follow updates.


Wave 3 coming
Now BTC is in range (see attached idea).
The Breakout of the Bullish Flag Pattern is shown in the chart. ETC is Bullish.
I think last week's retracement is related to wave-2 (Elliott Wave), as a result, Wave 3 coming.


ETCUSDT has formed a descending Triangle H1
Welcome back Traders, Investors, and Community!
Hi Traders, ETCUSDT on Daily Time frame has broken above the resistance with a big red candle but it seems before it goes higher it’s making a pullback.
On the H4 the price has formed a descending Triangle so which is a sign of trend continuation.
⬆️Buy now or Buy at 39.761
⭕️SL @ 31.970
✅TP1 @ 61.246
✅TP2 @ 71.248
✅TP3 @ 83.903
We will have more FREE forecasts in TradingView soon
❤️ Your Support is really appreciated!❤️
Have a Profitable Day

💡Don't miss the great buy opportunity in ETCUSD @eth_classicTrading suggestion:
". There is a possibility of temporary retracement to the suggested support line (39.761).
. if so, traders can set orders based on Price Action and expect to reach short-term targets."
Technical analysis:
. ETCUSD is in a range bound, and the beginning of an uptrend is expected.
. The price is above the 21-Day WEMA, which acts as a dynamic support.
. The RSI is at 48.
Take Profits:
TP1= @ 61.246
TP2= @ 71.248
TP3= @ 83.903
TP4= @ 95.690
TP5= @ 114.991
TP6= @ 135.735
TP7= @ 180.043
SL= Break below S2
❤️ If you find this helpful and want more FREE forecasts in TradingView
. . . . . Please show your support back,
. . . . . . . . Hit the 👍 LIKE button,
. . . . . . . . . . Drop some feedback below in the comment!
❤️ Your support is very much 🙏 appreciated!❤️
💎 Want us to help you become a better Forex / Crypto trader?
Now, It's your turn!
Be sure to leave a comment; let us know how you see this opportunity and forecast.
Trade well, ❤️
ForecastCity English Support Team ❤️

ETC still strongDespite BTC movements, ETC has held good during this bloodbath. Expecting to see a bounce around ~$50.


The ascent is on the way "ETC" BINANCE:ETCUSDT
Looking at the diagram, we see the formation of this harmonic pattern.
If supported in the PRZ area, you can open a buy position
Tip 1: Be sure to check Price Action in the support area
Tip 2: Stick to the loss and profit margins
Third point: the responsibility of buying and selling is with you, this is only my personal opinion
BEDON FILTER

The ascent is on the way "ETC" BINANCE:ETCUSDT
Looking at the diagram, we see the formation of this harmonic pattern.
If supported in the PRZ area, you can open a buy position
Tip 1: Be sure to check Price Action in the support area
Tip 2: Stick to the loss and profit margins
Third point: the responsibility of buying and selling is with you, this is only my personal opinion
BY FILTER


etcusdt price predicition breakout timeetcusdt making breakout pattern lets see where go price upside yeah downside
NOTE:- etcusdt is very bullish
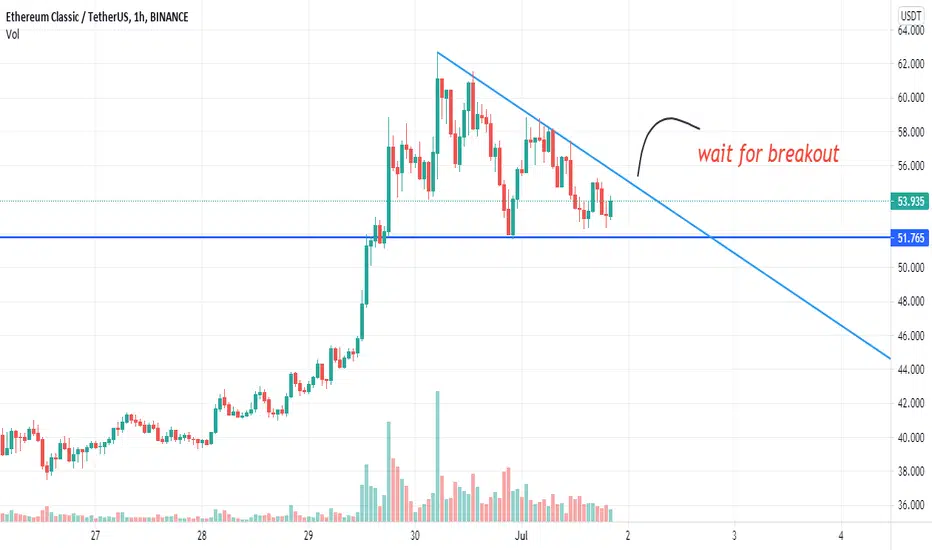

ETC Flag bull patternETC has make flag bull pattern. when etc get out from sideways line, ETC will jump to 65-70$
buy more at the 60%
