belive or not ... ETC gonna make +500% profits 🚀 🚀right now as we can see ETC confirmed a first breakout for the last resistance it bounced from , we can see a daily candle will be closing above it.
however let us take a look on the situation from a longer time, we can realize that ETC is not a garbage coin as we all thought it was just consolidating for a huge movement in 2021 !
as per the chart the main resistances hasn't been broken yet since the bullish cycle started which indicates for amazing potential will be coming out , ETC will be exploding remember my words
MIDTERM SIGNAL TRADE
✅ Buy: 16.70 - 18.30 ✅
🎯TARGETS:
1- $22.25
2- $36.00 (WILL BE REACHED IN APRIL 2021) - take profit for small portion maybe 15% - 20%
3- $61.57 (take profit for 40% - 45%)
4- $106.0 (take profit for 30% - 35%)
5- $122.1 ( preferable not to wait, small possibility to reach there before 2022 )
💵 Trade Size: 7% - 10% of Portfolio
🚫Invalidation(SL): daily candle close below $10
Please click LIKE button and Appreciate my hard work.
Must follow me for latest crypto real time updates.
thank you
ETCUSDT


#ETC #HighRiskTrade # Long Around $100 Sl 88 Target $130After the 5th of May 2021, all the sharp have pump Etc to crazy drive around 100% gain before go back and build flat price around $100 which is above and support by the MA9 and uptrend price line
(High risk ) Trading plan : Entry around $100 , Sl at $87 Target $130 As R:R 1:2

ETC IS 1000$ +%3800 - JUST WATCH, BE THE FIRST AREAIt is definitely not investment advice.
Make your investments at your own discretion.
Remember that these investments are real money.
I am not a Phenomenon. I'm not at all the type to fool someone.
People determine the price of a product.
I'm not telling you anything other than what I saw.
2 people like my articles, coincidentally, 2 thousand people view them.
Do you think there are no millionaires like me among them? .
Winning is the hardest thing in the world. Patience takes courage.
Do you think they didn't drop BTC from 10 thousand dollars to 3 thousand dollars?
Coincidence is over 50 thousand today. Stand behind your decisions whether you win or lose.
For your fears, I threw this money into the trash.
I will wait for years. say and forget. Get over $ 200.
I will share your detailed news. $ 200 is not a place of sale.
1000 dollars is the place of sale.
I SAY TO THE FEARS. DO NOT SELL UNDER $ 1000.
DO NOT LET THE GOODS HAVE BEEN INTO THE NEW BULL SEASON.
SELL WHO WANTS TO SELL.
I DO NOT MAKE AN INVESTMENT ADVICE. I STILL BUY.
WHO WANT TO BUY FROM GREEN HILL 8 AND SELL EARLY.
THINK DOG EYE GREEN MONEY. ETCS LEVELS ARE LIKE BNB.
BNB WAS 15 US Dollars.
ETH HAS WAS 80 TIMES.
LOOK TODAY. 700 $ - 3500 $ -
The season has just started. WE ARE AT THE BEGINNING OF MAY.
Even the name is charisma, think of it like this, Classic cars, Classic suit, Classic is something that everyone likes. THIS COIN WILL BE LIVE IN THE SEASON OF HOW MANY MONTHS, WHEN THIS WILL NOT BE 1000 $, SHIT COIN WILL BE 1000 DOLLARS
has maximum supply = 210,700,000
active now = 116,313,299
The name of this coin is ethereum, I'm not saying anything else.
The codes are the same coincidence, just the same, money was not transferred in the past.
was transferred. sounds very, very cheap to me. I'll buy it today, I'll buy it tomorrow, I'll take it next week.
Be sure. Everyone who follows will win. I will share with you your levels.
Anyone who sells their premium for under $ 1000 will regret it later.
First Half Premium LEVELS. ( Speacial Software)
10.755 225.855 451.71
10.755 236.61 462.465
21.51 247.365 473.22
32.265 258.12 483.975
43.02 268.875 494.73
53.775 279.63 505.485
64.53 290.385 516.24
75.285 301.14 526.995
86.04 311.895 537.75
96.795 322.65 548.505
107.55 333.405 559.26
118.305 344.16 570.015
129.06 354.915 580.77
139.815 365.67 591.525
150.57 376.425 602.28
161.325 387.18 613.035
172.08 397.935 623.79
182.835 408.69 634.545
193.59 419.445 645.3
204.345 430.2 656.055
215.1 440.955 666.81

#ETC #ETHERUME_CLASSIC #ETCusdtNice stock below Red line $44.6.
I do prefer to watch the process,
We have two strategies here 1 AND 2, BUT I think 2 is more probable...
Green area is a proper place to BUY...
Lets see what will happen...???
Trend line and Fibonacci are both my reliable tools.

ETCUSDT 1hour Technical Analysis1-Macd is selling green cutted red line
2-RSI still selling show
3-CCI all sell
4-Stocastic Selling show but green trying cut for give buy.
Stuation if cntinue like this. With 1 hour Technical ETCUSDT can go to SELL if you looking Dily technical Price is very High. Where will be explode?

Etc "Enjoy Guys"A few days ago i shared this signal if double top is broken we will see it's price towards 80$ enjoy Guys who followed my signal and nice profits done ✅
My previous analysis ⬇️
Follow me for more signals and ideas
Thanks

ETC/USDT 762% pure Profit from our entry so book profit#ETC/USDT Profit update:
$ETC currently trading at $76 and and went upto $82
So now you are in huge profit.
762% pure profit without leverage.
Entry was : $10 ✅
TP1: $21 ✅
TP2: $42 ✅
TP3 : $62 ✅
TP:- $80 ✅
Guys hope you very very happy with my analysis.
Close your positions and book huge profit.
Please Click LIKE button and appreciate my hard work.
Don’t forget to follow me for latest crypto real time updates.
Thank you for your unpredictable love and support.


COME ON BEAR WHALE - ETC İS HODL TİMEIt is no different from etc ethereum.
even the guy who wrote the software vitalik is the same vitalik.
Don't be afraid to shake it off. Sharks are on hold.
Whales are on hold,
Special Software says BUY, BUY, BUY Of course,
if there are whales that can break them, we are waiting.
We are ready to wait 20 years to wait 10 years.
If you can drop it, we will buy 2 times as 5 times.
States forbid. Until you die Etc. We say.
Our team Strong will laugh at those who sold it before $ 1000 because we expect it to come to $ 1300.
There are no cheap goods left in this market.
Don't be afraid. Do you think it is too low? Take it again.
Since this mining system will not quite sink etc, there is no problem.
It is definitely not investment advice.
I share what I have invested in.
I don't go in with all my money.
It's Not Time to Fear, It's Time to Fear.
Yearly ready
Montly ready
Weekly ready
3day ready
day ready
12h ready
4h ready
1h ready
Please scare us Bears :)

ETC is 40x potantiel %4200 Etc is Big Rise 25-30-40-60- 88 $ and 400$ ... max 1240$ to 1440 $
Not invesment idea
Fasten belts ...
Winter is Coming...
Risk is our business.
Big money, Big lose,
Little money, Little lose,
Fear does not have a child. Look forward to your future.
Everything decentralized is very valuable.
1 btc = 1 btc
1 eth = 1 eth
1 etc = 1 etc
Welcome to Hodl Company (People Bank)
Take note of those who see the future.
Vısa,Mastercard,Paypal,Tesla,Amazon,GrayScale,Blackrock,Microstrategy, Oracle,
In the future, Banknotes, Iron coins will be Garbage.
Credit cards, Phone payments, Crypto payments will be in fashion.
90% of coins in crypto will sink
but
%10 will increase more and more every day
Welcome to Information Age 1945 to 2045
make your investments like throwing money in the trash, never wait for it to come back.
The exchange system is always set up in such a way that the small investor and the big investor will gain profit.
Bitcoin and Limited Cryptocurrencies Never lose their value. Buyers determine the price.
The system that will prevent that crypto closure is the mining system.
States and People can lower their price. But they cannot ban the internet.
Science will limit Capitalism.
Technology will improve every day.
People will get lazy everyday.
Look to the future with hope. Observe the Moon and the Sun.
But remember the only truth.
Faith,Time, death, there is no more.
Thank u.

ETC TargetsHello traders! Congratulations to all ETC holders, as we are beginning to break through the green zone which was our previous all-time high. In my opinion, if we can break through $50 with conviction we will begin to go much higher and my two targets of interest are $80 and $120. I think ETC has the potential to reach these targets due to the fact that it is easily accessible to new traders, as it is available on every exchange and Robinhood. Newbies will see how high ETH went and they will purchase the "cheaper" version in hopes of making a profit. Additionally, the fractal is not part of my strategy per se, but nevertheless, it is interesting to see how that fractal brings us exactly to the $120 price target.
WARNING: This post is my personal opinion, please do not consider any of it financial advice. Do your own research!

ETC/BTC 500% up from our Entry so congrats for Huge profit#ETC/BTC Profit Update:-
#ETC currently trading at 12537 Satoshi
And Our entry was 2000-2100 Satoshi
Now 500% up from our entry.
Hope you enjoying our Profit ride.
Entry:- 2050 Satoshi ✅
TP1:- 3028 Satoshi ✅
TP2:- 5101 Satoshi ✅
TP3:- 7242 Satoshi ✅
TP4:- 12400 Satoshi ✅
Now 500% pure profit from our entry.
Now you can close 100% positions here and book huge profit.
Please click LIKE button and Appreciate my hard work.
Must follow me for latest crypto real time updates.
Thank you.

ETC breaking out and doing it quick!I almost didnt have time to finish this chart before it had already hit the upper fib line. I actually should be trading it right now instead of doing this chart. Anyways All the profits are labeled. Good Luck! should be easy money!

1000$ Easy Target Long Be - Not jokeForget all the Graphics, Buy and Keep, This ETC will go up to $1000.
Just wait 3-5 years
Ethereum Classic is no different from Old Ethereum.
It is more valuable because it has a maximum number on top.
and the number of miners is increasing every day. This is the opportunity.
We're not bashetting from $ 50-100, here we bash at $ 1000. You will realize that it is no joke later.
PREMİUM BUY ETC
it is not investment advice. I bought it. I'm saying without fear.
I'm waiting for short whales.
Let's see who will kiss whom.
Forget all the Graphics. Don't let them shake you up. 1 $ buy 10 $ buy, 20 $ buy, 30 $ buy, 40 $ buy, 50 $ buy, 100 $ buy.
#HODL , Hodl , Hodl
Those who are afraid to invest, please do not buy.

Etc Ready For 🚀Etc has broken the double top and now we can buy it and it will pump hard
Thanks of you agree just got the like button

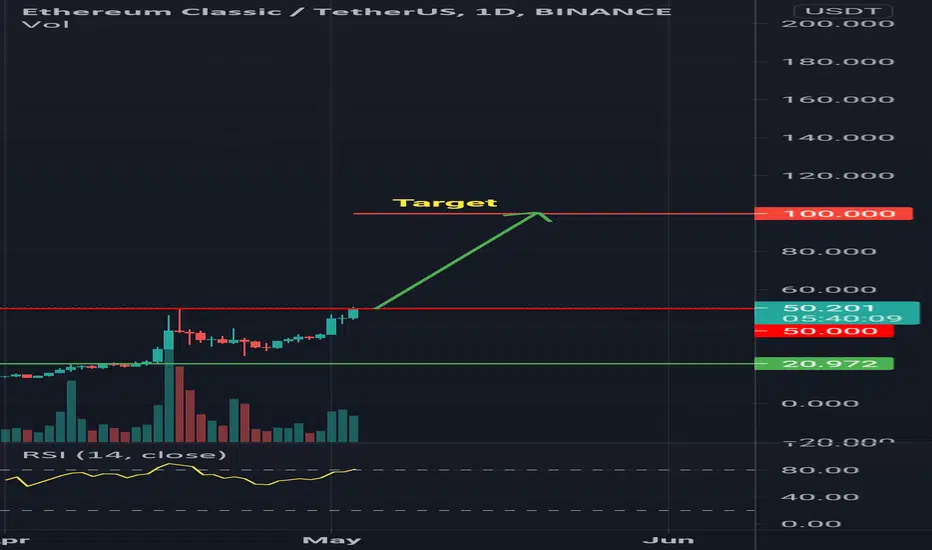
100 ETC is on the wayEtc is on track to go to $100. Once it breaks this $50 resistance it is ready to go.
update ETCUSDTupdate ETCUSDT
if 4H candle close above 42$
It is possible break last High
and reach for TP1 ,TP2

ETC 1D Price is near the all-time high, where next?Today we will look at the price action of ETCUSDT
In just over a year of growth, the price of ETCUSD rallied by making x17, finally reaching an all-time high that was set back in early 2018.
On the one hand, it seems like x17 is a good result, but if you take into account the fact that ETC is a fork of ETH and +|- repeats the price movement behind it, we think the result is not very impressive. Ethereum is 60 times more expensive than EthereumClassic, and it was able to update the 2018 absolute maximum more than twice in the same time.
By the way, here we have a series of ideas for ETHUSDT
So, Classic is now for the second time trying to update the 2018 maximum, which was around $47 and so far it has not been very successful.
Now the most positive scenario for the growth of the price of ETCUSDT is a possible break of the stops of shorts, which can hide above $50 . Such actions can provoke squeeze growth to the $57-60 area.
Above growth is not yet visible for us.
_______________________________
Since 2016 , we have been analyzing and trading the cryptocurrency market.
We transform our knowledge, trading moods and experience into ideas. Each "like under the idea" boosts the level of our happiness by 0.05%. If we help you to be calmer and richer - help us to be happier :)

I See Great opportunity ON ETC/USDTas you see there are great Cupandhandle pattern, It will be made up very soon and its very good time for buying in next 2-4 trading days.
"analyse by KEEDER"

The Big Picture for ETC/USDTThis macro pattern puts us around $50 after everything is done playing out

UPTADE ETCUSD SHORTOK, ETC touched 45.5$
ETC has resistance at 50$. If #ETCUSD breaks that resistance it can predict $ 55, $ 60, and $ 65 points. But be careful.

