#ETC/USDT Might Be Good Zone to Bounce From#ETC
The price is moving within an ascending channel on the 1-hour frame, adhering well to it, and is on its way to breaking strongly upwards and retesting it.
We have support from the lower boundary of the ascending channel, at 19.61.
We have a downtrend on the RSI that is about to be broken and retested, supporting the upside.
There is a major support area in green at 19.34, which represents a strong basis for the upside.
Don't forget a simple thing: ease and capital.
When you reach the first target, save some money and then change your stop-loss order to an entry order.
For inquiries, please leave a comment.
We have a trend to hold above the 100 Moving Average.
Entry price: 20.30.
First target: 20.83.
Second target: 21.32.
Third target: 21.95.
Don't forget a simple thing: ease and capital.
When you reach the first target, save some money and then change your stop-loss order to an entry order.
For inquiries, please leave a comment.
Thank you.
Etcusdtlong
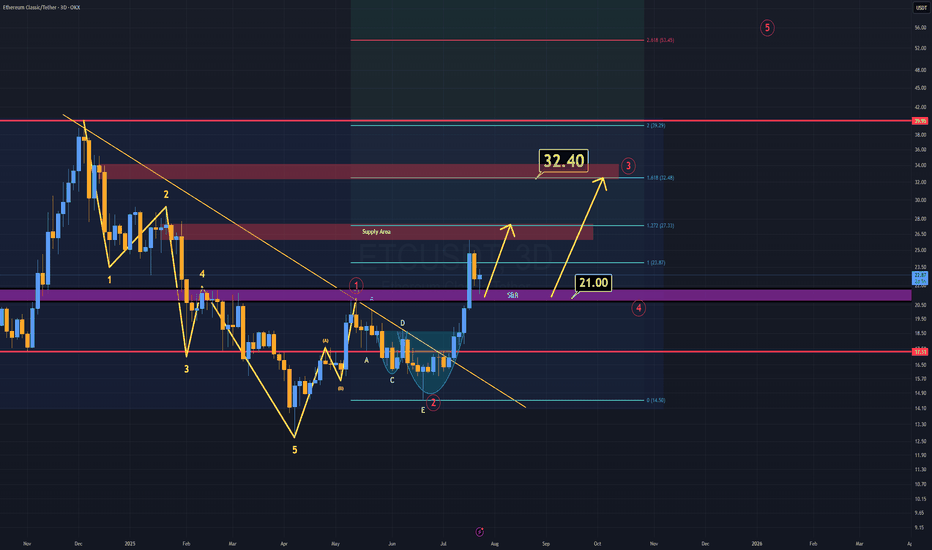
ETC Analysis (3D)ETC is showing a strong bullish structure, just like many other altcoins.
The key difference? ETC has already confirmed its breakout.
As long as ETC holds above the $21 level, I believe the minimum target sits at $32 in the coming weeks.
According to Elliott Wave Theory, that $32 region also marks the end of wave 3, which perfectly aligns with a daily supply block, a strong technical confluence.
Recently, ETC tapped the rebuy zone, highlighted in purple (S/R zone) on the chart.
Lower timeframes also support this bullish continuation scenario.
Momentum is on the side of the bulls.
S wishes you the best of luck!
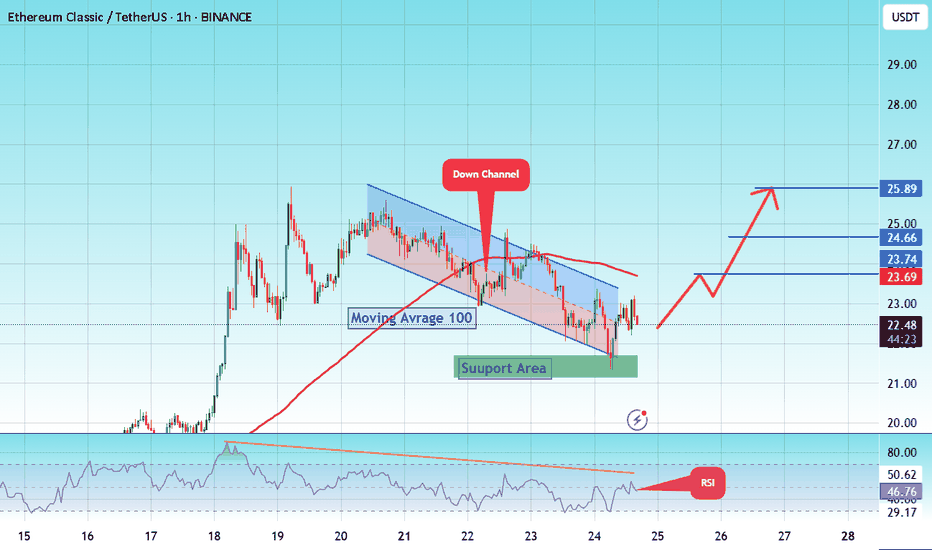
#ETC/USDT Forming Strong Bullish Potential#ETC
The price is moving within a descending channel on the 1-hour frame and is expected to break and continue upward.
We have a trend to stabilize above the 100 moving average once again.
We have a downtrend on the RSI indicator that supports the upward move with a breakout.
We have a support area at the lower boundary of the channel at 21.80, acting as strong support from which the price can rebound.
We have a major support area in green that pushed the price upward at 21.20.
Entry price: 22.50
First target: 23.70
Second target: 24.66
Third target: 25.90
To manage risk, don't forget stop loss and capital management.
When you reach the first target, save some profits and then change your stop order to an entry order.
For inquiries, please comment.
Thank you.
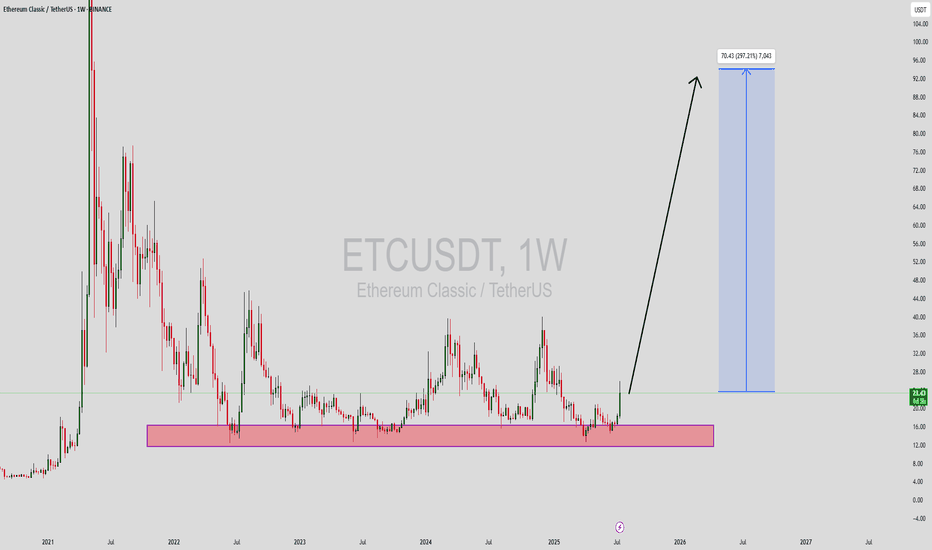
ETCUSDT Forming Strong Bullish PotentialEthereum Classic (ETCUSDT) is currently showing strong bullish potential as it emerges from a long-term accumulation zone. The weekly chart highlights a clearly defined support range where ETC has consistently rebounded in past cycles, and recent price action suggests another powerful move to the upside is brewing. With increased volume and momentum forming around the $15–$17 range, the price has broken out with significant strength, targeting an impressive 240% to 250% rally in the mid to long term.
Technically, ETC has printed a long-term rounded bottom pattern, signaling a possible trend reversal. Such formations often lead to explosive upside moves once the neckline resistance is broken, and ETC appears to be in that breakout phase now. A projected target near $80–$95 aligns well with historical resistance zones from previous bull runs. This is an ideal setup for position traders looking for a high-risk, high-reward opportunity.
Investor sentiment around Ethereum Classic is turning bullish again, driven by renewed interest in proof-of-work (PoW) assets and a potential alternative to Ethereum following its full transition to proof-of-stake. With Ethereum Classic maintaining its original blockchain structure, it continues to attract a niche set of supporters and miners. Growing community support and speculative demand could be key drivers behind this expected price surge.
✅ Show your support by hitting the like button and
✅ Leaving a comment below! (What is You opinion about this Coin)
Your feedback and engagement keep me inspired to share more insightful market analysis with you!
Ethereum Classic:Buying opportunity?hello friends 👋
Considering the price drop we had, you can see that buyers are coming in less and less in the support areas that we specified for you, and this can be a good signal to buy in these areas step by step with capital and risk management and move to the specified goals.
🔥Follow us for more signals🔥
*Trade safely with us*
#ETC/USDT#ETC
The price is moving within a descending channel on the 1-hour frame, adhering well to it, and is heading towards a strong breakout and retest.
We are experiencing a rebound from the lower boundary of the descending channel. This support is at 16.
We are experiencing a downtrend on the RSI indicator, which is about to break and retest, supporting the upward trend.
We are heading for stability above the 100 moving average.
Entry price: 16.50
First target: 17
Second target: 17.50
Third target: 18
#ETC/USDT#ETC
The price is moving within a descending channel on the 1-hour frame and is expected to break and continue upward.
We have a trend to stabilize above the 100 moving average once again.
We have a downtrend on the RSI indicator that supports the upward move with a breakout.
We have a support area at the lower boundary of the channel at 16.50, which acts as strong support from which the price can rebound.
Entry price: 16.62
First target: 16.80
Second target: 17.00
Third target: 17.24
etc usdt"🌟 Welcome to Golden Candle! 🌟
We're a team of 📈 passionate traders 📉 who love sharing our 🔍 technical analysis insights 🔎 with the TradingView community. 🌎
Our goal is to provide 💡 valuable perspectives 💡 on market trends and patterns, but 🚫 please note that our analyses are not intended as buy or sell recommendations. 🚫
Instead, they reflect our own 💭 personal attitudes and thoughts. 💭
Follow along and 📚 learn 📚 from our analyses! 📊💡"
#ETC/USDT#ETC
The price is moving in an ascending channel on the 12-hour frame and is sticking to it to a large extent
We have a bounce from a major support area in green at 17.70
We have a downtrend on the RSI indicator that was broken upwards, which supports the upward trend
We have a trend to stabilize above the 100 moving average, which supports the upward trend
Entry price 18.40
First target 20.38
Second target 22.33
Third target 24.37
ETC — August 2024 ATHBITFINEX:ETCUSD is not a clone of BITSTAMP:ETHUSD , but a continuation of the original Ethereum launched in 2015, which The Ethereum Foundation forked away from by launching a new protocol one year later in 2016.
Applications on BITFINEX:ETCUSD have been operating uninterrupted for a year longer than on Ethereum™, making ETC the longest-running and most reliable Smart Contract Platform.
This analysis suggests that BITFINEX:ETCUSD is likely to reach all-time high in August 2024.
NFA. DYOR.
ETC ( Ethereum Classic ) tm:1hHello traders.
I hope you doing well.
These areas are based on my personal strategy and I will share it with you.
Open a sell position on the supply area or open a buy position on the demand area.
Your entry point, stop loss, and target point are based on money management and the amount of money in your trading account.
But I promise you that by trading in the areas of my trading strategy, you will definitely make a profit, because these areas, although they seem simple, are my experience of 8 years of learning and trading.
I hope you will achieve maximum continuous profit with me by using supply and demand areas.
Good luck traders.
Mohammad Goodarzi
#ETC/USDT#ETC
We have a bullish trend pattern on a 4-hour frame, the price moves based on it and adheres to its limits well
We have a tendency to stabilize above moving average 100
We have an uptrend on the RSI indicator that supports the price higher
Entry price is 26.00
The first goal is 27.87
Second goal 30.16
Third goal 32.15
ETC Holders! FOLLOW ME~!Good day, friends!
This is ESS team.
Let's see the ETCUSDT.
If Candle is supported by the lower GREEN uptrend line, We expect that candle breaks through the RED long-term downtrend line.
The waves that supported the lower GREEN uptrend line have broken through the downtrend line in the past.
If it fails to break through the RED long-term downtrend line this time, It may be expected to rise after accumulation from the ORANGE uptrend line.
ETCUSDT Bullish Opportunity with XABCD Harmonic PatternOverview:
ETC/USDT has exhibited the formation of an XABCD harmonic pattern, coinciding with price action nearing a crucial support zone. This confluence suggests a potential bullish reversal from point D, indicating favorable trading opportunities for market participants.
Key Technical Observations:
1. XABCD Harmonic Pattern: The chart analysis reveals the emergence of an XABCD harmonic pattern, characterized by distinct price swings that conform to Fibonacci ratios. This pattern indicates a potential reversal zone, with point D signaling a probable shift in market direction.
2. Key Support Area: Price action has approached a significant support area, enhancing the likelihood of a bullish rebound. The convergence of the harmonic pattern and the support zone strengthens the validity of the anticipated bullish move.
Trade Recommendations:
- Entry: Consider initiating a long position near 32.8150, aligning with the anticipated bullish reversal at point D of the harmonic pattern.
- Stop Loss: Implement a stop-loss order at approximately 31.1750 to mitigate potential losses in case of adverse price movements.
- Take Profit Targets:
1. TP-1: Set the first take-profit level at 34.5800 to secure profits as the price advances in the bullish direction.
2. TP-2: Aim for the second take-profit level at 36.1933 to capitalize on further upward momentum.
3. TP-3: Consider a third take-profit target at 37.8760 to maximize returns as the bullish trend potentially extends.
Risk Management:
Maintain prudent risk management practices by adhering to the specified stop-loss level and adjusting position sizes according to individual risk tolerance. Periodically reassess the market conditions to adapt trading strategies accordingly.
Conclusion:
In summary, the technical analysis of ETC/USDT suggests a favorable outlook for bullish opportunities, supported by the formation of an XABCD harmonic pattern and price action nearing a critical support area. Traders are advised to consider the provided trade setup, incorporating appropriate risk management measures to optimize potential returns while safeguarding against downside risks.


