ETF Approval and Market TrendsMany have reached out with questions about the implications of the SEC's recent Bitcoin ETF approval and its potential impact on the market landscape.
In response, I've decided to conduct a comprehensive analysis to shed light on these developments, aiming to offer clarity and insights into what lies ahead:
What does the SEC's approval of Bitcoin ETFs signify for the market?
The SEC's approval of Bitcoin ETFs is a transformative development for the crypto market, signaling a new level of acceptance and legitimacy for Bitcoin as an investable asset. This action by the SEC is indicative of a regulatory environment that is beginning to adapt to the evolving financial landscape where digital assets play a significant role.
Expanded Significance for the Market:
1. Institutional Adoption:
The approval of Bitcoin ETFs can be seen as an invitation to institutional investors who have been on the sidelines due to the lack of regulated investment vehicles. Institutions often prefer to invest in regulated markets, and ETFs provide this, along with the traditional investment structure they are accustomed to.
2. Increased Accessibility:
ETFs trade on traditional stock exchanges, which means investors can buy into Bitcoin just as they would purchase shares of any other publicly-traded company. This familiarity removes the technical barriers associated with buying and storing cryptocurrencies directly.
3. Enhanced Liquidity:
The introduction of Bitcoin ETFs is expected to increase liquidity in the Bitcoin market. Higher liquidity tends to reduce volatility, potentially making Bitcoin a more stable investment in the eyes of cautious investors.
4. Potential for Diversification:
Investors looking to diversify their portfolios now have an easier route to include Bitcoin. Since Bitcoin and other cryptocurrencies often demonstrate low correlation with traditional asset classes, they can be an attractive option for portfolio diversification.
5. Market Maturation:
The approval is a step towards the maturation of the crypto market. It suggests that cryptocurrencies are becoming an integral part of the financial system, potentially paving the way for other digital assets to gain similar acceptance.
6. Validation of Asset Class:
By greenlighting Bitcoin ETFs, the SEC is essentially validating Bitcoin as an asset class. This could encourage more cautious investors who were waiting for a regulatory seal of approval to consider cryptocurrency investments.
7. Pricing and Valuation:
With ETFs, the pricing of Bitcoin becomes more transparent, as the ETF price reflects the current market valuation of Bitcoin. This transparency is crucial for investors who may have been concerned about the opaque pricing mechanisms on cryptocurrency exchanges.
Impact on Investment Strategies:
1. Retirement and Long-term Portfolios:
Bitcoin ETFs could start being included in retirement accounts and long-term investment portfolios, which would have been difficult or impossible before due to regulatory or custodial concerns.
2. Sophisticated Investment Vehicles:
The approval could lead to the development of more sophisticated investment products and strategies around Bitcoin, such as inclusion in mutual funds, pension funds, or insurance products.
How might this approval affect Bitcoin's price?
Historical parallels with the first spot gold ETFs suggest that the approval could lead to a significant increase in Bitcoin's price. The introduction of gold ETFs resulted in a dramatic appreciation of gold prices over a decade, and if Bitcoin follows a similar trajectory, a considerable increase in its price could be expected. However, the immediate market reaction can be varied. Some analysts argue that the market has not fully priced in the potential effects of ETF approval, anticipating a massive supply shock and substantial capital inflows. Others expect a more tempered short-term price movement with potential peaks followed by periods of stability.
What does the current technical analysis suggest about Bitcoin's market conditions?
Bitcoin's current technical indicators on the weekly chart illustrate a bullish trend:
Bollinger Bands: The price is at the upper range, indicating high volatility and bullish conditions, but also the potential for a pullback.
Volume: A substantial trading volume supports the strength of the current trend.
Simple Moving Average: The price above the SMA suggests a continuing uptrend.
Ichimoku Cloud: The price above the cloud is a strong bullish signal.
MACD: A positive MACD above the signal line indicates bullish momentum.
Together, these indicators suggest that the market is currently in a bullish phase, but caution is warranted given the potential for volatility.
How do market sentiments and fundamentals play into this analysis?
Market sentiment is buoyed by the ETF approval, and the fundamentals are strengthened by the prospect of increased institutional participation. The technical indicators are optimistic, yet they are only part of a comprehensive analysis that must include external factors such as market sentiment, regulatory developments, and macroeconomic trends.
What should investors be wary of in the current market conditions?
While the bullish indicators and the potential capital influx from ETFs are promising, investors should be mindful of overexuberance. Markets often "buy the rumor, sell the news," meaning that much of the optimism around anticipated events may already be reflected in the price. The weeks following the ETF launch will be crucial for observing whether the market has indeed fully priced in the ETFs or if the new investment vehicle will continue to drive price appreciation.
Conclusion and Outlook
The green light from the SEC for Bitcoin ETFs is a big deal for the crypto world—it could mean more big-money players stepping in and a sign that the crypto market is growing up. Right now, the charts are pointing to good vibes, with prices climbing. But remember, the world of investments is tricky, and Bitcoin's next moves will really hinge on how the big guns in finance take to these new crypto-flavored ETFs, what everyday buyers do, and the overall health of the economy. We're in some exciting times, so keeping an eye on how things unfold is key as we steer through these new waters.
Remember, this analysis is for informational purposes and should not be taken as financial advice.
Enjoyed the analysis? Don’t forget to hit like, drop a comment with your thoughts, and share it with your friends.
ETF

$BTC extreme bullish sentiment & most orderly movementAs stated before, there's extreme bullishness on $BTC.
Every influencer's excited & media is plastering a bull take.
They can be right but more often than not they are wrong and can be used as a contrarian indicator.
Things to notice:
#BTC shorts are @ their LOWEST in a year!
Money Flow is lessening.
Decent sell volume at the moment.
----------------------
Let's look at weekly data, chart shown.
Weekly CRYPTOCAP:BTC shows that indicators are weakening.
(Indicators aren't primary means of trading but are used for HELP)
Let's compare #BTC to other time periods, shall we?
Are we more like early or late 21?
This is most orderly run since the introduction of derivatives.
Looks almost like an Index, interesting, sarcasm.
#Bitcoin #bitcoinhalving #ETF

Ascending Triangle Points to Bullish ContinuationIntro
BINANCE:BTCUSDT gearing up for a significant move today, and I'm here to break down the potential price action. Over the weekend, BTC moved interestingly, closing the CME gap and aligning with the CME's close price as we stepped into Monday. With this setup, we're eyeing an imminent breakout.
Weekend Wrap-up and the CME Gap:
The weekend saw Bitcoin hovering below the CME gap, but as predicted, it pulled back to around the $52,160 mark by Monday. This retest sets us up for the next leg.
Ascending Triangle Formation:
On the charts, Bitcoin is carving out an ascending triangle, a classic continuation pattern hinting at a bullish outcome. Given the trend's bullish nature, I'm eyeing an upward move, with immediate targets set around $54,000. Should a bearish scenario unfold, which seems less likely now, support at $50,000 will be crucial.
ETF Flows and Market Reaction:
The Bitcoin ETF market dynamics play a pivotal role. Although ETF flow data is typically available the next day, I'll be the first to update on Twitter. These inflows can trigger the breakout, so stay tuned.
Liquidation Heatmap Update:
A staggering $1.2 billion in Bitcoin short positions has accumulated above the current price level. A break above $53,000 could trigger a massive squeeze, potentially propelling BTC towards and beyond $54,000.
Funding Rates and Market Sentiment:
High funding rates indicate a market leaning towards long positions, a sign of bullish sentiment. Though it also suggests caution as markets could be getting overextended. But in bull markets, this is common.
Technical Milestones:
Bitcoin's weekly close has confirmed above the critical 0.618 Fibonacci level, a bullish signal historically leading to robust bull markets. The next resistance to watch is between $57.5k to $58,000, my target for the next potential pullback.
Ethereum's Outlook and the Upcoming ETF:
COINBASE:ETHUSD is also worth your attention as its Spot ETF looms, set to debut in about 95 days. With a lower market cap than Bitcoin, inflows could have a more pronounced impact, making ETH a compelling trade in the coming months.
Remember, whether you're trading on the spot or futures, stay updated, and don't overextend your positions. Bitcoin is showing all the signs of a bull run, but as always, the markets can surprise us.

AXISCETF Looking BullishHello friend please look at the chart of AXISCETF huge volumes are building with adx , Di strength please provide feed back

🔥 Bitcoin: Fibonacci Signals New All-Time High Soon 🚨In this analysis I want to compare the start of the previous two bull-cycles with the current one. Specifically, I want to look at the Fibonacci retracements drawn on the chart.
During the start of the bull-runs, the 0.618 (light blue) Fibonacci retracement has always played a key role. First, the price has always rejected once from the 0.618 area once (red arrows). However, the second time that the price reaches the 0.618 Fibonacci retracement it has always broken through.
This break out has always started a new bull-run with new all-time highs. If history will repeat, we can expect that BTC is going to see a few very bullish months ahead and will make new all-time highs in the near future.
Do you think that this is the bull-run that we've been waiting for? Share your thoughts🙏

$BTC bullishness is really taking offAm seeing a ton of bullishness on CRYPTOCAP:BTC at the moment.
Extreme bullishness is okay but one should always take caution.
Keep in mind that volume has NOT been optimal but there was a bump not long ago. We're not changing anything and still long #crypto at the moment.
Let's see how #BTC reacts the next few days. Would like to buy some more on a dip.

ETH #TIMBER! // "Buy the dip" levelsNotes on how I personally use my charts/NFA:
Each level L1-L3 and TP1-TP3 (Or S1-S3) has a deployment percentage. The idea is to flag these levels so I can buy 11% at L1 , 28% at L2 and if L3 deploy 61% of assigned dry powder. The same in reverse goes for TP. TP1: 61%, TP2:28% and TP3:11%. If chart pivots between TP's, in-between or in Between Sell levels these percentages are still respected. I like to use the trading range to accumulate by using this tactic.
Just my personal way of using this. This is not intended or made to constitute any financial advice.
This is not intended or made to constitute any financial advice.
NOT INVESTMENT ADVICE
I am not a financial advisor.
The Content in this TradingView Idea is for informational purposes only, you should not construe any such information or other material as legal, tax, investment, financial, or other advice. Nothing contained within this idea constitutes a solicitation, recommendation, endorsement, or offer to buy or sell any securities or other financial instruments in this or in in any other jurisdiction in which such solicitation or offer would be unlawful under the securities laws of such jurisdiction.
All Content on this idea post is information of a general nature and does not address the circumstances of any particular individual or entity. Nothing in the idea/post constitutes professional and/or financial advice, nor does any information on the idea/post constitute a comprehensive or complete statement of the matters discussed or the law relating thereto. You alone assume the sole responsibility of evaluating the merits and risks associated with the use of any information or other Content on the idea/post before making any decisions based on such information.

Bitcoin Divergence & Wallstreets ETFBitcoin's Latest Price Rally
Curious about the recent upswing in Bitcoin's value? It's not just your average uptick; it's a major play by Wall Street, diving into Bitcoin ETFs with substantial capital influxes. We're talking a serious $494 million boost in Bitcoin's market, indicating a strong institutional endorsement that's far beyond day-trading buzz.
Bitcoin ETF Inflows: A Closer Look
When you see a massive $494 million pouring into Bitcoin ETFs, it's clear that Wall Street is making a decisive move. This level of investment is a significant bullish signal for Bitcoin, often leading to heightened market activity and upward price pressure.
The Divergence...
Here's the deal: the 4-hour Bitcoin charts are hinting at a bearish divergence. Despite the bullish sentiment, these indicators suggest a possible reversal, with a considerable amount of liquidations looming between $40k to $48k. It's a delicate balance that could tilt the scales at any moment.
Liquidation Levels
Taking a glance at the liquidation heat map, we observe a substantial buildup, a clear sign that the market could be overleveraged on the long side. As the cost to maintain these positions climbs, it's a critical moment for traders to be vigilant and ready for potential shifts.
In Conclusion
What do we make of all this? It's a classic battle of market forces. Wall Street's hefty investment in Bitcoin ETFs is driving the price, creating a hot market. Yet, with the presence of bearish divergence and a significant stack of potential liquidations, there's a hint of caution in the air. Wise traders will be monitoring these developments closely.
Over to You
Agree with this breakdown? Or do you see things differently? Hit the like button, share your insights below, and follow for more market analysis that cuts through the noise.

12/02/24 Weekly outlookLast weeks high: $48582.05
Last weeks low: $45414.55
Midpoint: $42247.04
What a crazy rally from BTC last week! From the very start creating the weekly low and the end of the week creating the weekly high with a near perfect linear move up.
With 49K as the local high consolidation just under this level is extremely bullish and with the halving moving ever closer BTC is looking very strong currently. I believe that most people myself included would see one last drop towards the mid 30K range to really catapult up from there, the big ETF players could lower their DCA and propel BTC to a new ATH a few months after the halving. However max pain would simply be BTC leaving everyone that is waiting for lower prices side-lined and push up towards the highs ahead of schedule.
So for this week a close eye needs to be on the structure of BTC around this local high. Any swing fail pattern would be very tempting to enter a short position, I believe a lot of people would welcome that setup, if that was the case you would need a very tight SL in case the rally continues. The more chop we see at these levels the more likely that is too happen in my opinion.

What does the arrival of Spot Bitcoin ETFs mean for US investorsAfter a long journey, the first spot bitcoin exchange-traded funds (ETFs) were approved in the United States of America. This is the latest step on the path to bitcoin, and digital assets more generally, becoming mainstream. To help clarify how this chain of events unfolded, and where the story could go next, this is an edited summary of a discussion with Ryan Louvar, Chief Legal Officer at WisdomTree, which took place in full on the Crypto Clarified podcast1.
The main points covered were:
The main obstacles that had to be overcome for approval
The reasons why a spot bitcoin ETF is a positive for investors and digital assets’ place in a portfolio as a diversifier
What to expect in terms of uptake over different timeframes
What to expect in the near future as the asset class becomes more mainstream
Benjamin Dean (BD): Ryan, happy bitcoin spot ETF effective date to you.
Ryan Louvar (RL): It’s a super exciting day. Even going back six months ago, I can’t say I was on the optimist side. But seeing the Securities and Exchange Commission (SEC) grant an effective registration statement to allow bitcoin ETFs, as well as the listings, is great.
Obstacles to overcome
BD: What were those final obstacles that had to be overcome and how have almost a dozen different issuers had their applications approved and become effective?
RL: I was on a panel at Bitcoin 2021 with a couple of other ETF issuers. We were asked to predict if we thought that 2021 would be the year. There was some optimism because the new chairman of the SEC, Gary Gensler, had spoken at MIT about this topic. However, there were hurdles before through that prior SEC administration. I said that there was a decent chance 2021 would be the year. But we have a new SEC administration now, and the similar denials continued. The rationale was that there just aren’t enough protective mechanisms in place to create a market that would be resistant to fraud and manipulation. Ultimately, the focus was on the spot bitcoin market, and the SEC said there needs to be a regulated spot bitcoin market of sufficient size to be able to trade. This was really against historical precedent because if you think about other spot markets like gold in particular, those ETFs had been approved and there isn’t a regulated gold market, certainly not one overseen by the SEC, and not one as had been described by the SEC as a requirement.
A watershed moment occurred when the SEC allowed futures ETFs, including bitcoin futures ETFs. They allowed a percentage of the underlying exposure to be futures and then allowed 100% futures exposure. Even at that point, WisdomTree was the first ETF to have any bitcoin futures exposure, with under 5% in one of our US-listed ETFs. The thought was that we were right there, almost at the finish line to then have a spot ETF. We chose at the time to have limited exposure because we thought that it had the potential to be a diversifier in a portfolio.
We chose not to launch a 100% bitcoin futures product just because of the potential issues in a 100% bitcoin futures product, such as contango and not tracking the price of bitcoin. We were very steadfast in our belief that a spot bitcoin product was the best execution for investors seeking exposure to the spot price of bitcoin. We leveraged our experience in Europe where we have a successful crypto exchange-traded product (ETP) range including a spot bitcoin ETP. There was really no action from the SEC until they got sued by Grayscale. There was a lawsuit from Grayscale, and they said that the SEC’s decision here, the denials, were just arbitrary and capricious. A court agreed with them.
It’s not often that the SEC loses. The court made it possible for the SEC to essentially include additional information for their decision. Based upon the past ten years, I thought that the SEC would continue to deny an approval and produce additional reasons for it. Ultimately, they had until 10 January to make that decision. Going back just three months ago, it wasn’t clear what path the SEC was going to take. It only became clear once the SEC started to comment on the prospectuses after a few years of silence, that cleared the way for progress. Then you saw ETF issuers filing updated S-1 type of registration statements that include the prospectus. This was really a couple of months ago.
Then you saw a flurry of activity from the regulatory side, updated prospectuses every couple of weeks, then updated prospectuses every couple of days, to now, we are launching this morning. Yes, that’s the history, it’s hard to believe. It’s really been truly historic. I mean, just the historical, call it a roller coaster ride.
Today we’re excited to be an issuer launching a spot bitcoin ETF, but it’s also historic to have all the other issuers launching as well. Our experience in ETFs both in Europe and digital assets is going to be a differentiator for us. It will be an interesting few months for sure.
Role in a portfolio as a potential diversifier
BD: Do you have any views or thoughts around how one should conceive the coming days, months, and years? What does success look like?
RL: If we look back on the birth of the US ETF industry with the SPDR, it took a couple of years for the SPDR to really take off and gain traction. Now it’s over 20 years old, and I think it’s over $300 billion at this point. I think we’ll see the same with bitcoin, in taking time to fully gain traction. Going back a couple of years, financial advisors told us they have clients who’d like to have at least a portion of their portfolio in an asset that can serve as a diversifier. It’s got to be the right client as bitcoin is a volatile asset, so there’s risk there.
Bitcoin can certainly serve its place in the right client’s portfolio. Those advisors will now be trying to work with their clients to understand the full financial picture. Their client might say, “By the way, I have bitcoin as well and it’s sitting in my personal wallets or on this third-party platform or wherever.” So, really, by having the vehicle that's suited to many investors in the ETF, it will really help from a financial advisory standpoint as well as a general investor standpoint to have that access.
The other thing is the transparency. ETFs have to disclose their holdings, so the amount of bitcoin a spot ETF holds will be available on the issuer website every day. Holding bitcoin in your own wallet can have some merit for a lot of people, but many don’t understand that mechanism or don’t want to. An ETF is a wrapper they do understand, and it comes with traditional third-party oversight from a trusted organisation like WisdomTree. It’s bringing a lot to the table but like any new asset, I think it’s going to take time for the marketplace to really absorb it. Certainly, a lot of the traditional ETF platforms are going to have to conduct diligence. A lot of that requires some track record, six months in some cases for some assets.
I think there will be demand, but it’s a journey. Today’s just the beginning. It’s not dissimilar to a floating rate Treasury ETF. Treasuries are renowned for being plain vanilla, but that took a little while to gain a bit of traction. Bitcoin is a very different asset to treasuries in terms of risk profile, but it can potentially have its place.
What could uptake look like in the near term?
BD: It’s an interesting moment in the United States because the couple of years really, have been negative and so acrimonious. You go to Asia or Latin America and people don’t have the same hangups. But in the US, it has been different.
RL: I was surprised when I travelled to many Asian countries over the summer and saw that bitcoin is widely available and used as a currency. Here in the US, being US-centric, we sometimes lose that perspective. We’re getting used to inflation in the US but not hyperinflation. So, it’s a great point that we don’t see in the US much, so it surprised me during my travels abroad.
Where does the digital asset industry go from here
BD: Looking at the US, what does this round of approvals mean for the digital asset industry? What do you see coming forward?
RL: I think the next turning point is Ether, the second largest cryptocurrency. There are now ETFs that hold Ethereum futures. So, if you think about the history, ETFs were first allowed by the SEC to hold bitcoin futures and then some months later, Ether futures. I do think those will be the next that might get attention.
To me, the biggest thing is that bitcoin and digital assets more broadly are being talked about as investable assets. For us at WisdomTree it’s important because we’re not only focused on ETFs, which has been our historical focus, we’re also bringing a direct-to-retail platform to investors in the US. Right now, they can directly access bitcoin via an app on their phone. They can directly access Ether, SEC-registered blockchain-enabled mutual funds and work with those in one portfolio.
So, I think having these avenues and bringing more attention to the asset class is only going to put a spotlight on how investors might be able to think about this new asset class and bitcoin in particular.
Sources
1 open.spotify.com
This material is prepared by WisdomTree and its affiliates and is not intended to be relied upon as a forecast, research or investment advice, and is not a recommendation, offer or solicitation to buy or sell any securities or to adopt any investment strategy. The opinions expressed are as of the date of production and may change as subsequent conditions vary. The information and opinions contained in this material are derived from proprietary and non-proprietary sources. As such, no warranty of accuracy or reliability is given and no responsibility arising in any other way for errors and omissions (including responsibility to any person by reason of negligence) is accepted by WisdomTree, nor any affiliate, nor any of their officers, employees or agents. Reliance upon information in this material is at the sole discretion of the reader. Past performance is not a reliable indicator of future performance.

BTC vs. MSTRI just did a little study lately regarding BTC and MSTR. The probability of breaking the lower side of this triangle is a bit higher, which should favor investment in MSTR over BTC. Whether you are buying Bitcoin on a crypto exchange or through one of these (upcoming?) BTC/USD spot ETFs.

Bitcoin UPDATE!ITS NOT FINANCIAL ADVICE!
as i can see last time bitcoin did not breake 49k and had hard resistance and in Weekly Chart bitcoin is showing alot of bearish signs no matter what u put on chart is always showing for bearish my idea is that Bitcoin can retest again 45-49K zone if it dosnt manage to breakeout we will see again the lows which is gonna be good for buying and holding till bullrun which i expect to be on year 2025 and its better to be 50% in and 50% out in this moment
NEWS ABOUT Grayscale FOR ETF!
grayscale momentaly is selling btc from their trust (theres a chance because the fees are too high for GBTC)
Germany In Recesion!
germany is the first country on EU to go in recession (Bearish Sign Too) and i expect since germany was the first country the others will go too
High Bank Loans FEES!
ETC,ETC,ETC

$BTC stays strong, light volume thoughYesterday, CRYPTOCAP:BTC broke out of the symmetrical triangle we had spoken about two days ago
Today;
#BTC RSI is breaking out of downtrend it's been in.
Money flow pumped higher for #Bitcoin over last 2 days.
All this has happened while the volume is lower.
This can only mean one thing....... that is a lack of sellers.
We're still bullish on #crypto
48k breaks we should see 51k easily.
IMO - Buys on pullbacks.

Another case showing BTC post is irrelevant as Derivatives dictaDaily
CRYPTOCAP:BTC shorts are non existent at the moment.
Short term, the #BTC downtrend is still intact.
There's a tiny symmetrical triangle formed. (direction broken will dictate the push)
Volume is paltry. As if there is a wait for something.
$ Money Flow & RSI not showing much.
----------------------------------
Weekly Chart
$ Flow better vs Spot #Bitcoin.
So much spot was sold yet it held, why?
What have we been saying for years?!?!?!
Spot doesn't matter, DERIVATIVES Dictate!!!!!!!

BTC Bitcoin Potential Rally soon!!I told you about the 'buy the rumor, sell the news' strategy on the Bitcoin ETF approval in the last article
We approached the price target of 39K last Friday, and I believe that was the last dip for now!
With the stock market at an all-time high, I anticipate crypto assets to follow suit.
Elon Musk is likely to implement Bitcoin and DOGE on his new platform, X Payments.
So, yes, exciting times ahead!
According to Elliott waves, the next price target for BTC is $43,500.

Bitcoin REALISM I am definitely not going to win any popularity competitions with my comments and thoughts. But that's not the point when it comes to making money.
The main issue for me still in Crypto Land is the lack of realism. The image on the front cover was from a google search of "realism" I guess the confused face made my day. This is exactly how you need to be looking when you read these points below.
I have explained the logic of every major move over the last couple of years and this guys - is no different.
So let's start by exploring the reality of market cap for one. When you buy a stock you have a number of stocks in circulation times that by the price and you can get a market cap. Of course, unlike most companies on the exchange Bitcoin CANNOT just issue new stock. We have to remember some Bitcoin are gone and lost forever so this number will likely end up around 20million and not the full 21m.
The current Market cap is roughly 19,806,000 x $42,897.
Let's call it a little over 820 Billion.
At the ATH of $69,000 we saw $1.302 Trillion.
Lets look at what is needed and an angle of attack if Bitcoin was to hit $500k by Jan 25, 26, 27, 28 or 2029.
This is only one aspect of the story.
Prior to the ETF launch people were saying silly things like "Trillions coming in, $100k imminent"
Blackrock's largest ETF is roughly $354 Billion. This is the SP500 fund founded back in 2001. So 23 years old roughly now.
Here's the actual chart.
What does this mean?
Well, let's say Blackrock decided to close their biggest ETF and throw it all into Bitcoin. That level would still not take us back to the current ATH.
Bullish, Bullish, Bullish - we are still $25,000+ under the current ATH.
So what about other ETF's? Obviously the market is bigger than just Blackrock. Let's look at this aspect too.
Look at the end of 2021 as the ETF market collectively was at it's high. We are talking about $10Trillion in 8,552 ETF's.
I've posted several times about the current COT landscape.
Clearly social media Bitcoin is buzzing and everyone is about to become rich, it's different this time and so on. Well, COT says otherwise.
Back at the top when everyone was calling for $135,000 I said the reason for the drop would be liquidity.
So why is this different?
I said there were two likely scenario's on the table as we moved down. The first was we were in an early stage accumulation, we needed to go up to 32k and back down to the low 20's. This would allow us to travel much higher and sustain such a large move.
The second option was bearish.
Well, I guess the second move played out.
The momentum is still clearly not with us - we are still FWB:25K + under the current ATH - not what one would or should expect after 12 Bitcoin specific ETF's obtaining approval & launching.
Look at the momentum
People seem to fall into the echo chamber and all logic leaves the building. I have been at this game a long, long time. Seen it all before and I am sure I will see it again.
This does not mean I am Bearish or anti Bitcoin - not for one second. I am one of the lucky ones in at the right time, sold a lot on the way up and happy with the current holdings.
All I am trying to emphasis here - is don't get sucked into the void which is not supported by ANY sound logic.
I recently watched a couple of video's with Warren Buffet, another with Jim Rickards.
They both explained something very interesting in a very clear way. Although Anti Bitcoin - what they said made a lot of sense. The same lesson kinda applies to things like gold.
When you buy an asset, the asset can produce for you. So assume you buy a house - you get rental income each month and with the price of the property going up over time you make gains there. Buy a business same thing - Buffet explained this using a farm as the example. Sell grains, cows or whatever you farm. Over time you still hold the asset.
This isn't true for the likes of diamonds, gold or Bitcoin.
Hence it fits into the greater fool theory.
If I sell you my last bitcoin I picked up for less than $200.
You buy it all today at $42,850. You have to find someone else willing to pay you more than the $42,850 in the future. For me, this is the main reason I don't personally care up or down or sideways here. But many in the echo chamber do.
The average price across the breakeven addresses are around $37k - this is Breakeven not profit. So imagine majority of the retail crowd with an average entry after DCA'in at $37k.
These are all things to keep in mind when your playing shorter term moves. ETF's are structured in such a way long term growth can be expected, volatility get's somewhat reduced. You noticed what's happened on the weekends since the launch?
So whilst I expect it to go up in the long run. We need a healthy pullback as to be expected. This gives more time for real accumulation to happen - but this will also put some stress on that average (BE) level of $37k.
Just keep this in mind and one more thing if you want to comment on "oh your wrong - up only" give some logic to support it or I won't bother responding. This move will take time. For me, nothing has changed since 2022. We are not ready for new highs - YET...
Anyway enjoyed or not I thought it was worth another educational post.
Stay safe!
Disclaimer
This idea does not constitute as financial advice. It is for educational purposes only, our principle trader has over 20 years’ experience in stocks, ETF’s, and Forex. Hence each trade setup might have different hold times, entry or exit conditions, and will vary from the post/idea shared here. You can use the information from this post to make your own trading plan for the instrument discussed. Trading carries a risk; a high percentage of retail traders lose money. Please keep this in mind when entering any trade. Stay safe.

Macro trend reversal: Uranium ETFMultiple geopolitical and macroeconomic factors providing strong tailwind for Nuclear power.
From a technical perspective, there is a massive macro trend reversal playing out here with volume behind it, which presents a promising long-term opportunity.
DYOR.
happy trades,
CD

Halving Forecast Just a quick idea on the state of BTC going into the halving. The countdown to the next big BITCOIN event has started, THE HALVING
Historically this is the event that kicks off the BULLRUN every 4 years. Mining rewards go from 6.25BTC to 3.125BTC and this gives miners a dilemma, do they hold on to their BTC they earn and only sell to cover costs, this diminishes the supply going into the market which raises prices assuming demand remains the same. Or if they do carry on selling their BTC it would be half the amount it was previously and still contributes less to the sells side pressure, raising prices. ETF issuers need these coins to offer to customers + retail investors returning to the market once FOMO enters the playing field.
DEMAND UP
SUPPLY DOWN
As for now I could see a mirror of the ETF rally being a logical path towards the halving. Filling the FVG at 33k would be a great long term entry point for any investor/trader should it hold as support. Once price has wicked down into that area and there's a reaction off that level then the bulls should look to push price for that 3 weeks or so going into the halving and beyond towards ATH as there's not much stopping it and history suggests this is the way BTC behaves after this event every 4 years.

Solana(SOL): Waiting For Perfect Setup! Solana coin has had massive growth, as we have talked about earlier, where the price seems to have topped out, and now we are looking for some correction.
What caught our attention here is our favourite middle line of Bollinger bands, which has been acting as a supportive line for the last couple of months.
Now that we finally broke the line, price is re-testing that zone, and we are looking here for some rejection to happen!!
We are not rushing into trading yet, but we see nice potential for both longs and shorts.
A long scenario would be active if we secured that upper resistance zone, which would lead to massive growth on the Solana coin!
What are your thought on Solana coin?? Will it see ATH soon or we will see a smaller correction before that?

🔥 Bitcoin Bulls Put Up A Fight: Still Waiting For A DumpYesterday we saw the BTC bulls put up a show with over 5% gains over the course of the day. Personally, I was not expecting such a bullish day to happen anytime soon. Part of the explanation is the oversold RSI on higher time frames for the first time in months, combined with shorts getting liquidated.
For now, I'm still not convinced that the bulls have the overhand in the short-term. A clear rejection from 42,200 indicates that bears are still dominating the short-term. However, if the bulls can pull through we might see a move towards 43,500 or higher.
I stand by my earlier analyses where I discussed my idea of the ETF being a longer-term top. To invalidate that analysis I'd like to see a move above 50k in the next 1-2 months. Personally, I think we're going to see 50k after the halving.
Time will tell.

Title: "Bitcoin's Bullish Surge: The Impact of EMA100 Uptrend"The Momentum behind Bitcoin's surge is the EMA100 (Daily) indicator.
Notice CRYPTOCAP:BTC has always reacted strongly after violating the EMA 100 either to the upside or downside,
My major concern is that we've had little to no volume on Binance
BTCUSDT
(Spots) Since March 2023 considering Binance is the No. 1 Exchange out there..
What's your Opinion?

$BTC trying to find footingCRYPTOCAP:BTC will likely see 1 more dip before it resumes it's uptrend, WHY?
There is still a decent amount of bullishness out there.
HOWEVER, if #Bitcoin can do the following:
RSI hold above halfway point
$ Flow gets better, which coincides with...
Buy volume increasing
Then the drop will likely not be harsh & we could have seen the bottom,

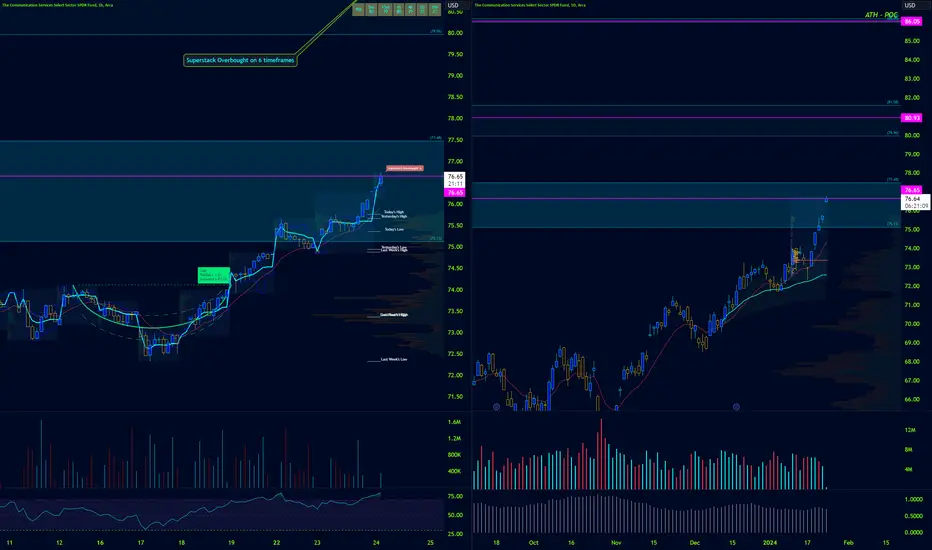
Gaps up into long term ResistanceGaps are for buying and selling right? Well, this gap is right into a 52 week resistance level, with all 6 timeframes decently overbought. Looking short here with first target at 75. This thing moves slowly so i'll revaluate whenever we get there. A move to 77 would not be ideal, allowing for a potential break and bounce of this POC level, giving some potential to longer-term continuation.