Bitcoin is reminding us who’s the KING
BTC grinding towards 45k while ETH stays at 2250
BTC dom keep going up after testing weekly EMA200 while sucking alts blood
ETHBTC about to break down
ETF or not, make sure you have enough exposure to BTC instead of 100% alts
Alts will have there time when BTC dom hits ~57%
Look for pairs that go strong against BTC not USDT
BTC.D (W)
Inverse ETHBTC (2W)
HAPPY TRADING!
ETF

BTC Market Update 7th January As BTC gears up for a significant shift, historical trends suggest a liquidity migration from altcoins to BTC. Yesterday's data and a thorough BTC scenario analysis lean towards a 'buy the news' stance, supported by bullish indicators in recent days:
📉 Open Interest (OI) Wipeout.
💥 Liquidation clusters favoring shorts, driving momentum.
💰 Tether printing resumes (significantly bullish).
📊 Bitfinex and Coinbase leading the tape, indicating bullish trends.
Flow indicators amplify the positive outlook:
📈 BITO's exposure hits an ATH of 41,000 BTC, with futures-based ETFs seeing a 310% increase in Volatility Share since October.
📊 CME's annualized basis remains above 10%, potentially decreasing post-ETF approvals due to BITO holders shifting exposure and possible redemptions.
Anticipating upcoming news, a surge in BTC may break through short clusters, pushing the price to 48k, possibly extending to 50k. However, profit-taking and the need for new narratives could trigger a retraction until the halving. Post-approval, analysts estimate a one-week timeline for the ETF launch.
Trade Ideas for the Next Move:
📈 Spot ETH ETF Trade: Long ETH/BTC (following the BTC playbook).
🔄 If BTC dominance rises, consider rotating into altcoins during BTC consolidation.
Stay tuned for updates as the crypto landscape unfolds! 🚀💹 #Bitcoin #CryptoAnalysis #ETF #TradingStrategies #CryptoMarkets

$PAW (PAWCHAIN) Next 200% Leg Up?$PAW (PAWCHAIN) Next 200% Leg Up?
Big move coming in less then 12 hours

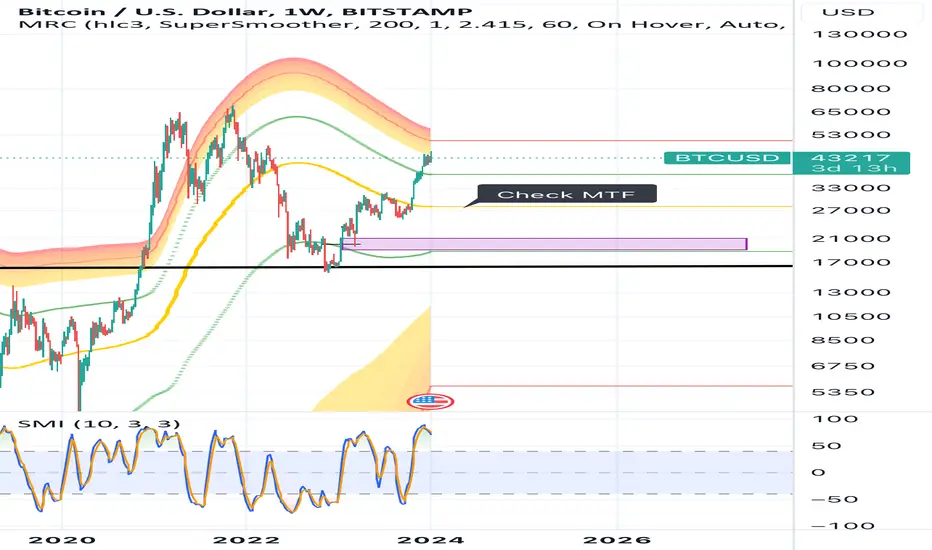
🔥 Bitcoin's ETF Might Cause A Major CRASH: Be Warned! 🚨In this analysis I'm going to take a more bearish (potentially very unpopular) stance on Bitcoin's ETF launch. More and more news seems to be seeping in about this highly anticipated spot ETF, which makes me believe that a launch is imminent.
Allegedly, there's a 90% chance according to Bloomberg that the spot ETF will be approved by January 10th, early next week. Just search your favorite crypto twitter person, youtuber or website and you can check for yourself.
Historically, big crypto news that the whole market is watching (see red lines) does not have an immediate bullish effect on the markets. Actually, big crypto news has a tendency to signal long-term tops like in December 2017 and October 2021.
Buy the rumor, sell the news. I'm strongly anticipating a big dump on Bitcoin's ETF launch news. Gamblers might be piling in on the news, taking BTC up to 48k or so (as mentioned in all my BTC analyses), but then the whales will dump on them and sell their positions that they've been building over the past year.
This dump will likely signal the top for the foreseeable future. We've got the halving in a couple of months, so the top will only be temporary. This dump might be your last chance to buy alts for cheap before the real bull-market starts.
No one knows how deep the dump will be. I'm looking at the yellow support for a target, but we could potentially go back to the 25k area.
Summary
ETF will potentially be sell the news event. Dump for few months. Buy cheap alts. Enjoy bull-market at the end of the year.

BTC SHORT/CRAB, LET GO.BTC looks to be in a short term distribution phase, with a likely top already in ~47k on CME.
Expect moderate volatility this quarter, where I expect constant violent 10% swings in either direction between 46k and 41k until the ETF approval. Afterward, expect a drop to ~38.5k by the end of January. Note, January EOM has the highest likelihood of dropping the furthest beyond the "Q1 High probability range noted on the chart" towards 34.5k.
Breaking out the Q1 Range will likely result in continued momentum to follow until the next line of support/resistance, noted at 50k or 34.5k.
The last line of defense will be ~31.6k in the event of a full liquidation cascade as it supports the previous sideways structure we had between 32k and 25k since March last year and acts as the 0.5 fib from the ATH to this cycle low. If we drop further under 30k, than you must accept the increased probability of 46k being a bull trap and being the largest rug pull to occur and we head toward revisiting 20k, 15, and even 10k.
RWI (Random Walk Index) and LS (Liquidation Screener) are the indicators used. RWI is printing bearish divergences along with starting to crossover toward bearish trend. LS probably has shown the top as it has hit the red bearish territory and recently dropped out of it and heading over the median line currently at 33.7k (but is rising and i could see it bottom out toward the lower side of Q1 probability range by EOM JAN or even EOQ)
Overall, I believe the ETF may be a sell-the-news event that will in the grand scheme of things crab between 46k and 41k, until the end of Q1, but with a short visit to 38.5k. Breaking out the expected range of 46k-38.5k, begets continued momo in the same direction. Take note this is likely due to lowered overall volatility of BTC maturing as a whole. But alts may push forward after the expected flush.
Let go. Relax.
Q1 Ranges:
High probability
46k-38k
Moderate probability
52k-30k
Max probability
54k-18k
Trades:
Short @ 44k
TP 41k, 39k, (may carry it down to 30k depending on PA under 39k)
SL 47k
Short @ 50k ( if expected range breaks out)
TP 40k, 35k, 32k
SL 54k
Long @ 39k
TP 44k, 50k
SL 37.5k
Long @ 35k & 32k
TP 40k, 50k
SL 29k

Bitcoin Analysis Happy New Year Everyone!
BTC Update today
Bitcoin Analyze ( BTCUSDT ), 4-hour time frame ⏰
The Bitcoin Dump was due to the possible rejection of all Bitcoin ETFs (Predicted by Matrixport).
I expect Bitcoin to go u to 44,100 and pullback to 41,800
*Follow For More!
*DYOR

ETH forming bearish engulfing on weekly and more...Battle happening with CRYPTOCAP:ETH at the moment.
#ETH pumps but it cannot hold them.
CRYPTOCAP:ETH is really struggling @ major resistance.
Recently it did break the uptrend and bounced back above.
As of now it's under it again and in the middle of an intraday downtrend.
#ETH RSI & $ FLOW peaked in mid November & have formed negative divergence since then this means it is weakening.
Volume is also lessening with some selling showing up.
CHART SHOWN IS WEEKLY
Weekly #Ethereum forms a bearish engulfing but it lacks volume
Arrows show previous instances.

BTC again at 44k whats next?Today we have seen a steady rise at level of 0.786
of fibbonaci retreacement. Trend is weak and
without momentum. lets see how the price will
react here though looking at other aspects as OI
or index money flow it looks a bit its just price
bounce after huge decrease and i am bearish
at this moment , and going into short here.
Tomorow there is high probability as experts says
that ETF will be solved soo we could see big move there.

Bitcoin will fall to 20k before the halving Bitcoin will fall through 20k before the next halving.
Tether are already starting to move USDT ready for it into wallets and onto exchanges
Be careful
NDX Nasdaq100 Fell 8.60% After the Last U.S. Credit Downgradeitch Ratings downgraded the US debt rating on Tuesday, moving it from the highest AAA rating to AA+, citing concerns about "a steady deterioration in standards of governance."
This downgrade happened following last-minute negotiations among lawmakers to reach a debt ceiling deal earlier this year, raising the risk of the nation's first default.
In the past, a similar credit downgrade had a significant impact on the NDX, which fell 8.60% in just two weeks. Back in August 5, 2011, Standard & Poor's, one of the major credit rating firms, downgraded U.S. debt after another major debt ceiling battle.
Jim Reid, a strategist at Deutsche Bank, pointed out that while the news of Standard & Poor's being the first to downgrade 12 years ago was substantial, investors had already adjusted their perceptions of the world's most important bond market, recognizing that it was no longer a pure AAA. Nonetheless, Fitch's recent decision to downgrade is still significant.
In the current scenario, the U.S. 10-year Treasury yield has risen to 4.15%, reaching its highest level since November 2022.
As for the price target for this year, it remains at $16650, as shown in the chart below:
Looking forward to read your opinion about it!

SPX S&P 500 Fell 10% After the Last U.S. Credit Downgrade !!!Fitch Ratings made a significant move by downgrading the US debt rating on Tuesday, shifting it from the highest AAA rating to AA+. The downgrade was attributed to a "steady deterioration in standards of governance." This decision followed intense negotiations among lawmakers to reach a debt ceiling deal, which posed a risk of the nation's first default.
The S&P 500 experienced a notable decline of 10% within three months after the previous U.S. credit downgrade. The downgrade occurred on August 5, 2011, by Standard & Poor's, one of the major credit rating firms, following another intense debt ceiling battle. The day after the S&P downgrade, the S&P 500 suffered a nearly 7% drop, dubbed "Black Monday." Subsequently, the benchmark index declined by 5.7% that month and an additional 7.2% in September.
Jim Reid, a strategist at Deutsche Bank, emphasized that the 12-year-old news of S&P being the first to downgrade was significant, allowing investors to adjust their perceptions of the world's most important bond market, which was no longer considered pure AAA. Nonetheless, Fitch's recent decision to downgrade remains impactful.
In the current scenario, the U.S. 10-year Treasury yield has risen to 4.15%, the highest since November 2022.
As for my price target for this year, it remains at $4900, as illustrated in the chart provided below:
Looking forward to read your opinion about it!

BTC Bitcoin ETF "buy the rumor, sell the news"BTC Bitcoin Price fell today amid speculation of ETF rejection.
Employing the strategy of "buy the rumor, sell the news," traders strategically capitalize on market movements by entering positions based on speculative information. This approach involves opening positions on rumors and closing them when the anticipated news is officially announced, typically resulting in a profit.
However, it's crucial to note that this strategy is often driven by the fear of missing out (FOMO). The surge in buying activity prior to the news can lead to heightened selling pressure from market participants once the news is confirmed. Consequently, the price of the asset is susceptible to a decline as traders liquidate their positions, emphasizing the speculative nature of such market dynamics.
My price target for BTC is about FWB:36K in this situation.

RUT 2K Price Prediction for 2024If you haven`t bought the Double Bottom on RUT 2K:
Then you probably know that small caps haven`t participated in the 2023 market rally.
That`s why I believe investors will will for opportunities in the small cap stocks in 2024, and Russell 2000 index might offer a bigger return than the S&P this year.
My price prediction for RUT 2K is $2560 by the end of the year.

QQQ Nasdaq 100 ETF Price Prediction for 2024This was my price prediction for QQQ in 2023. I was bullish, but not enough:
Considerations about 2024:
In the July 2023 meeting, the FOMC chose to raise interest rates to a range of 5.25%–5.50%, marking the 11th rate hike in the current cycle aimed at mitigating heightened inflation. The prevailing consensus among market experts hints at a potential shift in strategy, suggesting that the Fed might commence rate cuts later in 2024 as inflation gradually aligns with the Fed's 2% target. Statistically, historical data indicates that approximately 11 months after the cessation of interest rate increases, a recession tends to manifest. This pattern places us around June 2024, aligning with my prediction of a dip in the QQQ to approximately $370.
Given that 2024 is an election year, there's an additional layer of complexity in predicting market behavior. Despite the anticipated mid-year dip, my inclination is that the QQQ will conclude the year on a bullish note. This optimistic outlook hints at the onset of a 3-5 year AI bubble cycle, with the QQQ boasting a year-end price target of $460.
The integration of artificial intelligence into various sectors is expected to catalyze market growth and innovation, propelling the QQQ to new heights by the close of 2024.

SPY S&P 500 ETF Price Prediction for 2024This was my article about the SPY S&P 500 ETF price target for 2023:https://www.tradingview.com/chart/SPY/l6U1M9dJ-SPY-S-P-500-ETF-2023-Forecast-CPI-Report-Prediction/
I was bullish, but not enough!
In the July 2023 meeting, the FOMC opted to raise interest rates to a range of 5.25%–5.50%, marking the 11th rate hike in the current cycle aimed at curbing elevated inflation.
The prevailing consensus among market experts hints at a potential shift in strategy, suggesting that the Fed might commence rate cuts later in 2024 as inflation gradually aligns with the Fed's 2% target.
Statistically, historical data indicates that approximately 11 months after the cessation of interest rate increases, a recession tends to manifest. This pattern places us around June 2024, aligning with my prediction of a dip in the SPY to approximately $430.
Given that 2024 is an election year, there's an additional layer of complexity in predicting market behavior.
Despite the anticipated mid-year dip, my inclination is that the SPY will conclude the year on a bullish note.
This optimistic outlook hints at the onset of a 3-5 year AI bubble cycle, with the SPY boasting a year-end price target of $540.
The integration of artificial intelligence into various sectors is expected to catalyze market growth and innovation, propelling the SPY to new heights by the close of 2024.

Shocked @ $BTC and #crypto hit today?Good Morning!!!!!!!
In reference to the rout #crypto is taking, everyone's playing Monday morning quarterback.
The post quoted, pls see more info on our profile page, wasn't the 1st post with warning!!!
We had mentioned the breakout had a lot of selling with little buying to support holding the move. CRYPTOCAP:BTC gave up a large chunk of the gains.
We also spoke on #BTC $ flow lessening & the weakening RSI.
The CRYPTOCAP:BTC RSI looks to cross sub 50, it must hold 40ish area.
#BTC $ Flow hasn't looked good at all, buy on the rumor and sell news. Could be what's happening.
#Bitcoin forming a BEARISH ENGULFING. Recall NASDAQ:NDX did this and was walloped for a bit before recuperating. KEEP and EYE ON VOLUME TODAY!
Weekly, Bitcoin has formed an outside week, more on this later.
AMEX:BITO

Bitcoin Turns Down For Deeper Correction. Strong Support At 40k.Stocks are coming down at the start of January as some portfolio adjustments and profit-taking occurs at the start of a new year to avoid 2023 tax year. We can also see some dollar rally, but normally these flows at the start of the year are temporary and can be reversed later this month when flows will normalize. We also have a FED minutes today, but US PMI and NFP much more important this week I think.
Looking at bitcoin, its coming sharply down on speculation that SEC will reject ETF. Some nice support is at 40k.

02/01/24 Weekly outlookLast weeks high: $43821.44
Last weeks low: $42563.55
Midpoint: $41305.65
HAPPY NEW YEAR TRADERS!
A new year has arrived and with it another year of price action or BITCOIN. This year the general sentiment is as strong as it has ever been with ETF's & THE HALVING events in the first half of the year alone.
Last weeks price action showed a consolidation just under the local high allowing some of the lagging altcoins to run and others to cool off for the next move in the market. The rumour is ETF decision will be announced this week, there is talk of whether the event is a sell the news event or if it's bullish. I would say I'm sceptical and I have said previously I think it would be a sell the news, the majority of big money players would have made their money on the way up to the decision, not gamble on the result. BTC price tripled in 2022 and those kinds of returns for big investors are great, why risk the volatility after the decision. However... Having said that I would also be a fool to disregard the sheer power of FOMO, a big headline in the news about BlackRock's ETF approval would send retail investors back into the market to make a "quick buck" which brings a buying pressure, volatility and also a risk of a blow-off top.
A case for the bulls would be BlackRock would not want to let their brand new ETF look bad, it would need to be an attractive investment and so they would probably do their best to steady and volatility to be able to attract customers and extract fees from them.
I do also see BTC being at new highs by the end of the year, so depending on the timeframe of your investment you may be able to ride out the volatility of the ETF's, however you may get a better entry by being agile.

BTC Daily chart 24th December 2023Seasons greetings to all! Warmest wishes for you and your family during the holiday season.
In my last idea we saw that COINBASE:BTCUSD was able to break the double bottom neckline at 43,5K but was unable to create any significant momentum to continue the rally towards 45K.
Since the holiday season has started, a period with lower volatility, i am not expecting BTC to go much higher till we get some more news about the BTC spot ETF.
If the ETF is approved we will probably see a significant rally which will take BTC to at least 50K. If BTC will be able to break 50K and go higher, will depend on how much the ETF approval was already priced in. If people already bought the news then the ETF rally could be more modest than expected (e.g. 50K high instead of new ATH).
If the ETF is rejected, then we will probably see a major price correction, dropping BTC under 40K support line with a possible bottom as low as 32K (the breaking of this resistance line was sort of the start of the current bullrun, so a retest is likely in a major correction).
As you might have read, the SEC recently had a meeting with all the ETF applicants. I am guessing that the applicant probably received a heads-up of the SEC's oncoming decision. If the SEC has already decided that it will reject the current applications, we will see signs of a sell-off from now till 10th of January (when the SEC will formaly announce the rejection).
So if BTC starts retracing, this could be a sign that the ETF applicants are selling off a part of their BTC ahead of the expected sell-off.
Other than that i am not expecting any mayor moves during the oncoming week.

🔥 Bitcoin Break Out! 2024 Starts Off AMAZING 🚀Over the last couple of weeks I've been posting a lot of analyses on Bitcoin's bull-flag pattern. My expectation was always that the price would break out through the top resistance, with a target of 48k.
As of this morning, BTC has rallied hard on bullish ETF news. The break out is strong with a lot of volume, so 48,000$ seems imminent at this point.
Why 48k you ask? Well, it's the strongest resistance area before the all-time high. If the bears will fail to defend 48k, chances are were going straight to new all-time highs. For now I'm bullish untill 48k, neutral at 48k, and bullish again if we manage to break through 48k.
To all patient bulls: congratulations. The trend is your friend. But be wary, the bears might be lurking at 48k.

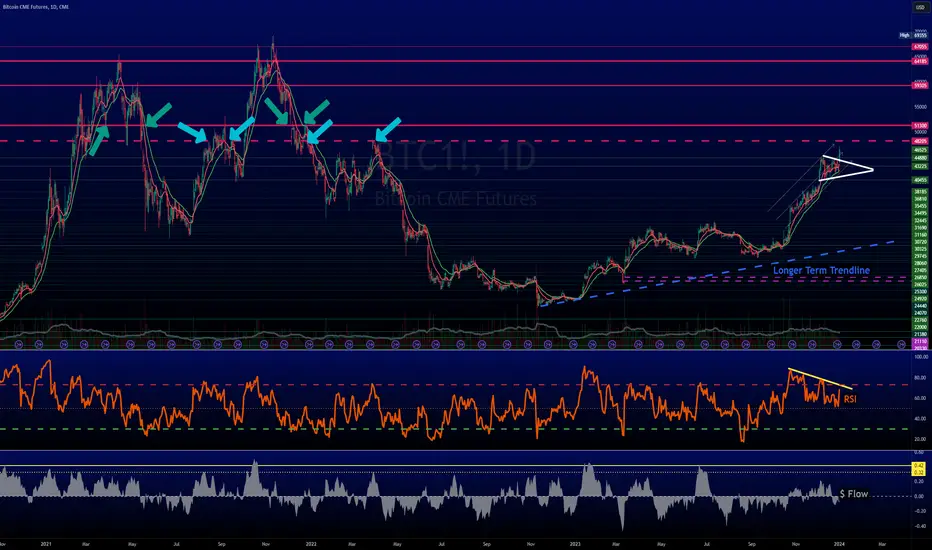
BTC held the 44kish call for 2023, 48-50k next before pauseGood Evening/Morning!
The call for CRYPTOCAP:BTC topping around the 44k range for 2023 was GOOD!
1st trading day and #bitcoin rips higher!
How's that for coincidence, huh?
The call for #BTC being in a temp pause & in a CONTINUATION pattern was GOOD!
IMO, the next level that #Bitcoin is most likely to test is the 48k with a good possibility of hitting low 50k area.
Let's continue.......
The RSI is still trending lower and $ Flow is not that great either.
Things can change though...
Why 48-50k? Arrows show the areas of resistance.
Even after breaking above this staunch resistance area, 50kish, Bitcoin didn't trade very long above it.
More on what we think later.... Still time...
For more info visit our profile page...
Market Algo or pain tradesI was reading another trading book today and much like watching the dumb money movie the other day, it prompted me to write another post.
So, you may have heard the expression "the market is an Algorithm" whilst this is somewhat true, it's actually more a sequence, Ralph Elliott, Richard Wyckoff and Edward Jones knew this.
In simple terms, the larger operators or what's known as sophisticated money - chase liquidity pools that are often areas Dumb Money have taken entries or placed stops. Now if it was as simple as this, you could simply write an indicator or be on the winning side 100% of the time. Unfortunately, there's a lot more to it!
When I say the smart kids are taking the dinner money of the dumb kids, you need to appreciate the fact that winning whilst playing against retail traders is like putting the Patriots against your local under 12's side. Or like having the New Zealand All Blacks play against an old people's home in Pakistan. (I am not sure if Pakistan even have a 1st team in rugby).
To gain some understanding, you need to appreciate there's such a thing as "pain trading".
A "pain trade" refers to a situation in financial markets where a significant number of investors or traders find themselves on the wrong side of the market, leading to losses or discomfort. In other words, it describes a scenario in which the market moves in a way that causes the most amount of pain or financial losses to the largest number of participants.
For example, if a majority of traders are positioned for a market to go up, a pain trade would be a sharp and unexpected decline in prices, catching those traders off guard and causing them losses. The term reflects the idea that markets often move in ways that inflict the most damage on the greatest number of participants.
Understanding pain trades is important for investors and traders, as it highlights the potential risks of crowded trades and the importance of risk management strategies to mitigate unexpected market movements. Investors and traders often use various indicators, market sentiment analysis, and risk management techniques to try to avoid being caught on the wrong side of a pain trade.
(Thanks ChatGPT for the summary).
======================================================
So take a company like Carvana for example...
This type of move happens over and over again - creating cycles (But not always the same).
In this image above you can see it's likely to have swept long stop losses and then rallied hard.
You probably know about the Gamestop Saga.
I wrote a post on that film recently.
I talked about being on the wrong side - I can't get over how someone could be up $500,000 and still go broke? But it's all in the mindset. Liquidity is the name of the game.
How do these things fit together?
Well, Bitcoin is a prime example - retail mindset is "HODL, Buy the Dip, Diamond hands & Lambo" - whilst as a professional trader, it's enjoying your profits and buying/selling at the expense of the dumb money. These moves are shown as the last post, buy momentum.
Here is the summary image from that post.
Since we had a move up - retail seem to think it's up only, they seem to put all the eggs in the hope Blackrock and a halving will make them rich...
I have read articles like this recently.
After watching the Dumb Money film - you know where following the crowd goes.
-----------------------------------------------------------------------
Why is this an important lesson?
It's all to do with pain, where is the maximum pain? Retail sentiment would suggest pain comes in the form of little movement, grinding prices in up moves and fast aggressive drops.
Some context from Blackrock themselves: What is Blackrocks Biggest ETF?
So again, let's add a little logic. Where is liquidity sitting?
If and it's a big if - Blackrock get an ETF approved and it's half the size of their biggest ETF to date, let's then assume Retail flood in and match it dollar for dollar. That market cap would still put us roughly at the current ATH, given coins in circulation.
This again just amplifies, why we are simply - NOT READY, YET!!!
The move I didn't want in 2022, looks to be the biggest liquidity grab we are likely to see in the Bitcoin chart.
We are very, very likely still in an A-B move up for the slow pain of coming back to build sustainable momentum.
Have a Happy New Year all!
Stay safe and see you in 2024!
Disclaimer
This idea does not constitute as financial advice. It is for educational purposes only, our principle trader has over 20 years’ experience in stocks, ETF’s, and Forex. Hence each trade setup might have different hold times, entry or exit conditions, and will vary from the post/idea shared here. You can use the information from this post to make your own trading plan for the instrument discussed. Trading carries a risk; a high percentage of retail traders lose money. Please keep this in mind when entering any trade. Stay safe.

BTC Market Update 12/30/2023BINANCE:BTCUSDT Bitcoin has recently seen a deceleration in the mid-$40,000 range, encountering resistance levels between $43,000 and $44,000 on both a weekly and daily basis. From a technical standpoint, surpassing this resistance zone is crucial for supporting a bullish continuation. Currently, the market is facing challenges in overcoming these levels.
To approach this situation cautiously, a positive sign of momentum would be a weekly close above $44,100. Alternatively, a more assertive stance requires a daily close above $43,900, indicating strength in the short-term trend.
Traders focusing on technical pullbacks to support levels should consider $37,000 as the earliest significant pullback level on the daily chart. However, this may be deemed an aggressive entry point.
Beyond technical analysis, a pivotal factor is the imminent decision on the spot ETF, expected in early January. This event has the potential to significantly influence market dynamics, and we anticipate it to be a "sell-the-news" occurrence that bottoms shortly before a surge towards the halving.
Prudent trading strategies involve either maintaining a long position from a lower entry point while anticipating volatility around the ETF announcement or adopting a wait-and-see approach until the aftermath of the ETF decision becomes clear.
